
Executive summary
Cash is the most frequently used form of payment by Europeans at the point of sale (POS).[1] For this reason, an adequate cash cycle infrastructure must be in place, with a sufficient distribution system allowing people and businesses to access cash through the automated teller machine (ATM) network, bank branches and other cash access points. Europeans need their cash to be accepted by retailers, while retailers need a proper infrastructure in place to be able to deposit the cash they receive.
Many other aspects must be considered in addition to a well-functioning infrastructure to ensure trust and a viable euro banknote cash cycle, such as the quality and security of the banknotes. Environmental, health and safety aspects should also be taken into consideration to make sure that the banknotes are safe to use and do not have a negative impact on the environment. The environmental aspects of euro banknotes and the cash cycle have not only been a priority for the Eurosystem since the launch of the euro in 2002 but are also a key element of its cash strategy.[2] Efforts have continued, and will continue, to reduce the environmental impact of euro banknotes.
Following the launch of the second euro banknote series – the Europa series – the ECB started to assess the environmental impact of euro banknotes as a means of payment with a new study.[3] This study is based on the European Commission’s Product Environmental Footprint (PEF) methodology.[4]
The aims of this PEF study are: (i) achieve a comprehensive knowledge of the potential environmental impact of all the activities of a full cash cycle of banknotes, from raw material acquisition and manufacturing to the disposal of euro banknotes, and (ii) measure the potential environmental impact of banknotes as a payment instrument, to help further identify aspects in the banknote life cycle that can be targeted to reduce the environmental footprint of euro banknotes.
This PEF study finds that the single overall score for the average annual value of cash payments per euro area citizen (EAC) in 2019 is 101 micropoints (µPt). This very low score is equivalent to an EAC driving a standard car for 8 km, or to 0.01% of the total environmental impact of a European’s annual consumption of activities.[5] To further illustrate this point, it is worth comparing the results of the annual value of euro banknote payments with those of other everyday products, such as the production of a cotton T-shirt[6] that is washed once a week for a year (comparable to driving 55 km) or the manufactured bottles of water[7] consumed by an EAC in one year (equivalent to driving 272 km), as illustrated in the figure below.
Figure 1
Comparison of the environmental footprints of euro banknotes and other common products
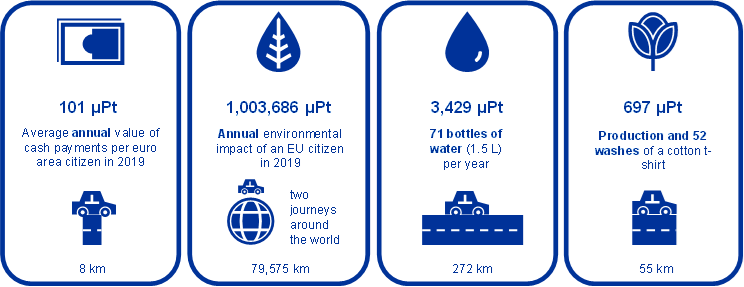
Note: A car journey equivalent is included for each.
The main activities contributing to the environmental footprint of euro banknotes are the powering of ATMs (37%), transportation (35%), processing activities in the distribution stage (10%), paper manufacturing (9%) and the authentication of banknotes at the point of sale (POS) in the use stage (5%).
Since 2004, efforts have been made to reduce the environmental footprint of euro banknotes. For example, the Eurosystem has imposed a landfill ban on banknote waste and implemented initiatives like the Sustainable Cotton Programme.[8] In addition, significant efforts have been made by ATM manufacturers and credit institutions to reduce their environmental impact. Our study shows that improvements in the energy efficiency of ATMs contributed to a 35% decrease in the single overall score of the cash cycle between 2004 and 2019.[9] Moreover, in addition to transport optimisation, other ways to reduce the environmental impact of transportation and use more sustainable fuels are being considered.
Even though the environmental impact of paying with euro banknotes is overall very low, the Eurosystem is committed to reducing it further. We are conducting extensive research and development to achieve this, while ensuring that cash is widely available to the public. This work will feed into the development of our future series of euro banknotes with a view to make them as environmentally friendly as possible. Similar or partial studies will also be carried out by the Eurosystem, in particular when a significant change has occurred in the cash cycle.
1 Introduction
Cash is an important part of our freedom to choose how to pay and essential for the inclusion of all groups in society. It is the most frequently used payment method at the POS in the euro area, as confirmed by the ECB’s December 2022 study on payment attitudes of consumers.[10] Access to cash is therefore of the utmost importance; it must be available across the euro area and close to where people live.
In addition to ensuring the availability and acceptance of cash, the cash strategy outlines the Eurosystem’s commitment to making euro banknotes as environmentally friendly as possible. This work on improving the sustainability of banknotes and the related activities is guided by the European Commission’s 2030 Climate Target Plan, which sets the overall target to reduce greenhouse gas emissions by at least 55% by 2030 compared with 1990, in line with the objective of the Paris Agreement and the EU’s goal to be climate-neutral by 2050. The plan is also in line with the ECB’s environmental strategy to reduce its carbon emissions by 46.2% (relative to 2019 levels) by 2030.[11]
Environmental sustainability has been a key concept since the introduction of the euro. In 2004, the Eurosystem conducted a life cycle assessment (LCA) to measure the environmental impact of the first series of euro banknotes. The assessment spanned from the production of raw materials to the disposal of banknotes once they had become unfit for circulation. This assessment has remained the main source of information for the implementation of concrete measures to reduce the environmental impact of the euro banknotes. These measures include: progressively introducing sustainable cotton sources into the manufacturing of euro banknote paper, with the aim to reach 100% by end-2023; giving a protective coating to lower banknote denominations to increase their lifetime; and implementing more environmentally friendly disposal methods for unfit-for-circulation banknotes and waste created during production (which ultimately lead to the landfill ban).
Following the launch of the Europa series completed in 2019, the ECB decided to conduct a new environmental impact assessment based on the European Commission’s PEF methodology.[12] This methodology provides a clear framework for conducting an LCA and allows experts to carry out an objective assessment of a product’s environmental impact.
This PEF study is more comprehensive than the first LCA study[13], and it involves the key cash cycle stakeholders to arrive at concrete results for euro banknotes used as a payment instrument. The study concerns pre-pandemic cash cycle data (i.e. data from 2019), thereby allowing us to use data that were not affected by COVID-19 restrictions. The current study focuses on the environmental impact of euro banknotes as a payment instrument; it does not address other euro banknote functions (like the store of value) and the impact that euro coins and electronic payments have on the environment. Section 2 of this study provides an overview of the euro cash cycle and its environmental sustainability aspects. Section 3 describes the main elements of this euro banknote PEF study, including the functional unit (FUnit) and the stakeholders who contributed to the study[14]. Section 4 discusses the main results and their interpretation, as well as sensitivity analyses and the impact of the Eurosystem’s environmental policies. The conclusions are presented in Section 5 and a glossary is included in Annex A.
2 The euro cash cycle
Today, the euro is the currency of 20 EU countries and over 346 million Europeans. Like with other goods, making euro banknotes available to all Europeans requires a well-functioning supply chain and smooth interplay between numerous actors.
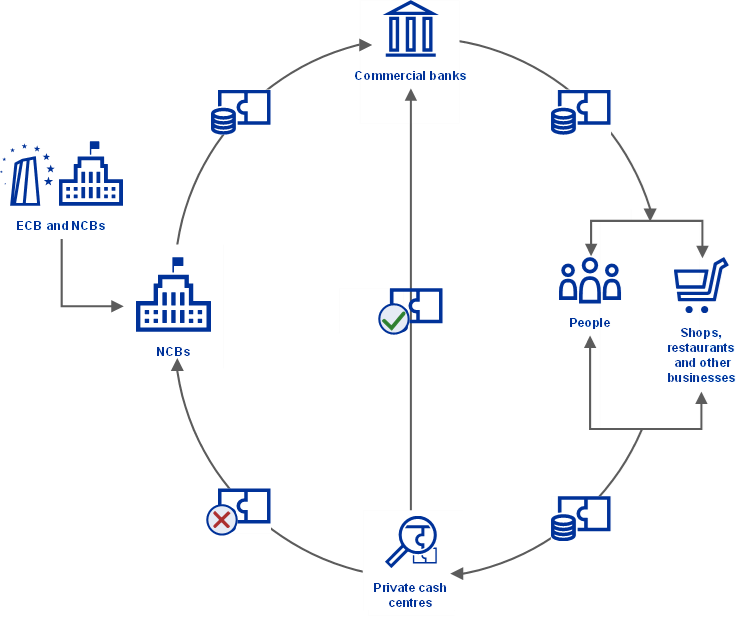
Figure 2 illustrates how these actors are interconnected by presenting the euro cash cycle in visual form. Newly printed banknotes, distributed by the NCBs of the Eurosystem, are fed into the cash cycle through commercial banks. This not only accommodates the demand for banknotes but also replaces worn-out notes so that those in circulation are of good quality.[15]
Europeans need an adequate distribution system to be able to access banknotes through the ATM network, bank branches or other cash access points. Once in circulation, euro banknotes undertake a long journey and are used and re-used by consumers and businesses alike.
Upon accepting a cash payment and checking the banknotes for authenticity, retailers need a proper infrastructure in place to be able to deposit the cash they receive. This means that there should be enough ATMs and other cash service points with a deposit function, both in urban and less densely populated areas. Commercial banks and ultimately NCBs also carry out authenticity and quality checks on the euro banknotes they receive. Only banknotes fit for circulation can be recirculated, while those deemed unfit are removed and eventually destroyed.
Figure 2
The euro cash cycle infrastructure
The Eurosystem is constantly exploring ways to provide banknotes and their related services to the people of Europe in the most efficient and sustainable manner possible. This requires analysing not only their own internal activities but also those of the cash cycle as a whole.
All work is conducted to ensure that euro banknotes ultimately remain easily accessible to Europeans and widely accepted as a form of payment in the most environmentally friendly way possible.
3 Euro PEF study methodology
The PEF is an LCA-based methodology that covers 16 environmental impact categories, including climate change owing to greenhouse gas emissions, ozone depletion, land and water use and resource depletion. All 16 of these categories are converted into a single indicator expressed in µPt, which quantifies the overall impact. This makes it possible to carry out a simple evaluation of the environmental footprint of euro banknotes used as a payment instrument and to draw comparisons with other products or activities. It is therefore a more detailed approach than other LCA methodologies, which only consider one or few impact categories (e.g. climate change owing to greenhouse gas emissions). Versions 2.0 of the PEF methodology and the Environmental Footprint (EF) database were used for this study.
The aims of the study are: (i) achieve a comprehensive knowledge of the potential environmental impact of all the activities of the full cash cycle of euro banknotes, from raw material acquisition and manufacturing to the end-of-life of the second series, and (ii) measure the potential environmental impact of banknotes as a payment instrument, to help further identify aspects in the banknote life cycle that can be targeted to reduce the environmental footprint of euro banknotes.
This study analyses the 2019 Eurosystem cash cycle,[16] collecting data from 19 NCBs, 23 accredited manufacturers (consisting of printing works, papermills and raw material suppliers of banknote features such as foil, thread and inks), and stakeholders such as cash-in-transit companies (CITs), cash centres, commercial banks and banknote equipment manufacturers (contacted by the NCBs and the ECB, respectively).
3.1 Functional unit and reference flow
In LCA studies, a FUnit needs to be defined. The FUnit defines the qualitative and quantitative aspects of the function(s) and/or service(s) provided by the product being evaluated. The FUnit definition answers the questions “what?”, “how much?”, “how well?” and “for how long?”.
This PEF study focuses on the payment function of banknotes in the euro area. It does not take into account other functions such as the store of value or use outside of the euro area. Consequently, the FUnit is defined as the “Average annual value of payments with banknotes per EAC in 2019”. This definition refers to people over the age of 18 in the 19 euro area countries.
Following the definition of the FUnit, the reference flow needs to be identified. The reference flow is the quantified amount of products in a given product system required to fulfil the function expressed by the FUnit. The reference flow of this study is the euro banknotes of all denominations consumed by a citizen in 2019 to fulfil the FUnit.[17] The results of the ECB’s 2019 study on payment behaviour show that an EAC used on average around €7,100 worth of banknotes to perform daily payments over one year.[18] As a result, on average 11.7 banknotes per EAC are worn out and need to be replaced by new banknotes. The corresponding numbers of euro banknotes per denomination (Table 1) have been estimated by analysing the transactional demand of banknotes, survey data on payment behaviour and the lifetime and return frequency of all euro banknote denominations.
Table 1
Number of banknotes consumed by an EAC for cash payments in 2019
Denomination | Number of banknotes |
|---|---|
€5 | 2.20 |
€10 | 2.93 |
€20 | 3.85 |
€50 | 2.15 |
€100 | 0.44 |
€200 | 0.06 |
Source: See calculations of the return frequency method in Alejandro Zamora-Pérez (2021)[19]
Notes: The term “banknotes consumed” refers to the number of banknotes that are worn out as a result of the average annual use by an EAC and therefore need to be replaced. Although factors are a proxy for annual consumption, they are implicitly related with the relative use of each of these denominations for transactions. For example, high-value denominations are consumed more slowly as they are generally used for store of value. Low-value denominations are consumed quicker as they are used for transactions more frequently, especially in low-value payments. However, it is worth bearing in mind that factors not only depend on the share of transactional use of each denomination, but also on other factors such as the number of pieces of each denomination in circulation.
As the FUnit of this study is the average annual value of payments with banknotes per EAC in 2019, this study does not calculate the impact of the production of all euro banknotes manufactured in 2019. This calculation would constitute a separate PEF study with a different FUnit.
The life cycle stages of the cash cycle of banknotes is divided into two blocks (see Figure 3 in Section 3.2). Block 1 corresponds to the first two stages: (i) raw material acquisition and pre-processing and (ii) manufacturing. Block 2 consists of the final three stages: (iii) distribution, (iv) use, and (v) end of life. The contribution of Block 1 to the FUnit is the production of the euro banknotes consumed (i.e. worn out) by an EAC in 2019.
Unlike Block 1, the outcome of Block 2 is directly linked to the FUnit defined, as all these activities support the banknote payment function of cash. The total environmental impact of the activities can be directly allocated to the FUnit by dividing it by the total number of EACs in the Euro Area (19 countries in 2019). The environmental impact of the FUnit is then the sum of the contributions of Block 1 and Block 2.
3.2 System boundary
In the PEF methodology, the system boundary defines which parts of the product life cycle and the associated life cycle stages and processes belong to the analysed system (i.e. which parts are required for carrying out its function, as defined by the FUnit).
This PEF study analyses all inputs and outputs of the cash cycle in a cradle-to-grave assessment, from the extraction of raw materials to the disposal of unfit banknotes. This includes all the relevant aspects of the distribution and use stage, such as transportation, consumption of energy and generation of waste.
Figure 3 shows the system boundaries diagram of this study. The whole life cycle of banknotes has been divided into the five standard stages of a PEF: (i) raw materials acquisition and pre-processing, (ii) manufacturing, (iii) distribution, (iv) use, and (v) end of life.
Figure 3
System boundaries diagram
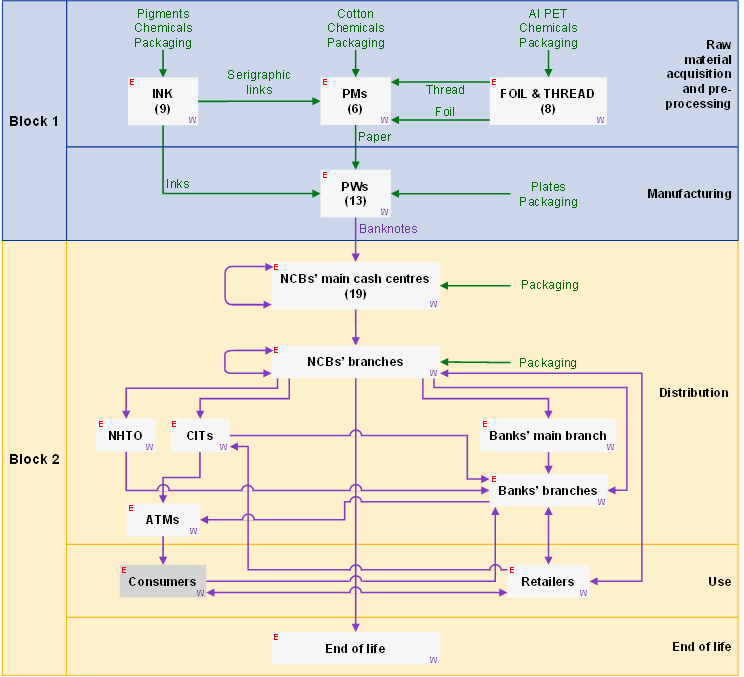
Notes: “PMs” stands for “paper mills”, “PWs” for “printing works”, “NHTO” for “notes held to order”, “W” for “waste”, “E” for “energy”, “Al” for Aluminium and “PET“ for polyethylene terephthalate. Consumers were excluded from the study as their direct environmental impact in making a payment is redundant.
3.3 Life cycle inventory
A life cycle inventory (LCI) involves creating an inventory of all the energy and raw material inputs and outputs, waste disposal, emissions into air, water and soil required for a product supply chain. The LCI forms the basis for modelling the PEF. Table 2 lists the life cycle stages, the activities of the euro banknote life cycle and the inputs used for this study.
Table 2
Main components of each life cycle stage of the euro banknote PEF model


The ECB collected the data for Block 1 (production of euro banknotes) by surveying the 23 accredited manufacturers – 11 printing works and 12 raw material suppliers (prepress plates, paper mills, foil, thread and inks) – that were involved in banknote production in 2019. The data for Block 2 (distribution, use and end of life of euro banknotes) were collected by the 19 NCBs, which directly liaised with the relevant stakeholders in their cash cycle.
All data received were validated, processed and standardised to the reference unit prior to inputting them into SimaPro, a dedicated commercial software, which performed the PEF assessment. These data are largely confidential; only aggregated results are presented in this study.
3.4 Modelling choices in the LCI
As part of a PEF study, specific life cycle stages, processes and other key aspects of the product life cycle must be modelled in order to compile the LCI. The table below describes the four main modelling choices of this study: cotton noils production, energy use of ATMs and other cash dispensing machines, transportation for distribution, and the use stage.
Table 3
Modelling choices in the LCI
Item | Description | Modelling choices |
|---|---|---|
Cotton noil production | Cotton noils (also called cotton combers) are used for the paper manufacturing of euro banknotes. They are a by-product of yarn production at ring spinning mills in the textile industry. Three types of cotton noils were used in 2019 to produce banknotes: conventional cotton, organic cotton and Better Cotton Initiative (BCI) cotton. | Creation of conventional and BCI cotton noil datasets based on Ecoinvent 3.8 datasets (in the absence of EF 2.0 datasets) for cotton yarn ring spinning for weaving and knitting, considering cotton noil as a by-product.Same for organic cotton noils, using Ecoinvent 3.8 datasets for organic cotton.Economic allocation between yarn (94.5%) and noil (5.5%) based on data gathered from the euro paper mills and the Bremen Cotton Exchange over a two-year period (2019-2020).Transportation from the cotton broker sites. |
Energy use of ATMs and other cash dispensing machines | Banknotes are distributed through the cash cycle to the users mainly through ATMs. | Electricity consumption calculated by multiplying the total number of ATMs in the euro area (311,461 in 2019) by the average annual consumption of one ATM.Average annual consumption on the combined power consumption for idle mode and operation mode (20 kWh weekly consumption per ATM).Use of the EF 2.0 “Electricity grid mix 1kV-60kV {EU-28+3} | AC, technology mix | consumption mix, at consumer | 1kV - 60kV | LCI result”, which includes a mix of renewable and non-renewable sources.Application of the EU 28 Conversion dataset for medium electricity voltage to low voltage.Raw materials and production excluded as capital goods (see Section 3.5) |
Transportation for distribution | Finished banknotes are transported from the printing works to the NCBs or specialised distribution centres. They are then transported by cash-in-transit companies to credit institutions and then to commercial banks or distributed through ATMs. Banknote transportation requires high security standards, in some cases involving police escort vehicles. | Manufacturing of the transportation vehicles (lorries and escort vehicles) excluded as capital goods.Transportation is divided into national transportation (from the NCBs and CITs) and cross-border transportation (between the NCBs).Articulated lorry EF 2.0 dataset with similar weight as armoured lorries;for NCBs, national and cross-border transportation with a utilisation factor of 45%;for CITs, national transportation with a utilisation factor of 30% and a 1.5 tonne payload.Kilogram-kilometre (kgkm) calculated based on the fuel consumption and the default kilogram of diesel, as per the related articulated lorry datasetIndividual transportation by retailers in personal cars excluded |
Use | Authentication checks performed by cashiers when accepting banknotes for cash payments using banknote authentication devices (BADs) and self-checkout terminals (SCoTs). | Electricity consumption calculated by multiplying the total number of BADs and SCoTs in the euro area by their respective average annual unit consumption, considering the devices are in operation mode during business hours.Use of electricity grid mix dataset as required by PEF method for use stages. This dataset includes a mix of renewable and non-renewable sources.Application of the EU 28 Conversion dataset for medium electricity voltage to low voltage.Average energy consumption by a BAD was 34.32 kWh, based on the nominal consumption (10W max.) and a use of 11 hours a day (between ten and 12), for six days a week and 52 weeks a year.Average energy consumption per SCoT (cash module only) was 15 kWh, based on the consumption information from manufacturers.The raw materials and production of authentication machines were excluded as they are considered capital goods.The manufacturing of wallets was also excluded as they serve multiple purposes; they are not just for storing banknotes. |
3.5 Exclusions from the study
This assessment excludes some elements from the system boundaries. The main exclusions are set out below.
- The PEF study focuses on the Europa series, and the €500 denomination was not included in this series. Production of the €500 stopped in 2016, but it is still in circulation. It is excluded from the production activities and end-of-life stage. However, for the distribution and use stages, it was considered equivalent to the Europa series €200.
- Production of capital goods, including machinery, equipment and facilities, as specified in the PEF methodology.
- Coins. Cash payments naturally include banknotes and coins, but coins have not been included in this study. The ECB is, together with the NCBs, the legal issuer of euro banknotes, while coins are under the control of the European Commission.
- Digital payments.
- Banknotes that were used for store of value in 2019. These banknotes might be used in the future but they were not used in 2019, the calendar year under consideration. However, the distribution phase (mainly the transportation and ATM stages) of euro banknotes cannot be split between euro banknotes to be used for transactional functions and the store of value function. As both euro banknote functions are included therein (and the FUnit considers only the transactional function of banknotes), the environmental impact of Block 2 might be on the upper bound of the study’s results. The assessment also excludes wallets and safes that consumers use for storing money.[20]
4 Euro PEF results and interpretation
The euro PEF study on banknotes finds that the impact of the average annual payments of an EAC in 2019 is overall very small. To use an example, it is equivalent to the impact of an EAC driving a standard car for 8 km.[21]
The methodology and results of this euro PEF study have been formally validated by an external PEF reviewer. As required by the PEF method, a data quality rating (DQR) has been performed on the study. The overall data quality was deemed “very good”, in line with the PEF data quality requirements.[22]
4.1 Main results
The PEF methodology covers 16 environmental impact categories, including climate change owing to greenhouse gas emissions, ozone depletion, land and water use and resource depletion (the PEF impact categories are described in more detail in Annex B). All of these categories are converted into micropoints (µPt), which quantify the overall environmental impact. It makes it possible to carry out a simple evaluation of the environmental footprint of euro banknotes used as a payment instrument and to draw comparisons with other products and activities.
The single overall score for this euro PEF study, obtained after normalising and weighting the results calculated for the 16 impact categories considered in the PEF methodology,[23] is 101 µPt, which is a very low score (each impact category’s contribution to the single overall score of 101 µPt is shown as a percentage in Annex C). Furthermore, the environmental impact has improved since the Eurosystem conducted the LCA study to assess the environmental impact of the first series of euro banknotes in 2004.
For the overall result of this study to be meaningful, a comparison has been drawn between the environmental footprint of euro banknotes and that of other activities and products used by Europeans. The main activities contributing to the result are detailed in Section 4.3, while Section 4.4 outlines the sensitivity analyses that were conducted to assess the robustness of the study and to highlight the areas that can be further improved to reduce the environmental footprint of banknote payments.
4.2 Comparison between euro banknotes and other activities and common products
To get a better understanding of the results of this study, it is worth comparing them with other products and activities that, like euro banknotes, play a part in Europeans’ daily lives. For example, the environmental impact of an EAC’s average amount of banknote payments per year is equivalent to them driving a standard car for 8 km.
To further illustrate the low impact of banknote payments, Figure 1 compares their results with those of other everyday products. For example, the impact of the production of a cotton T-shirt that is washed once a week for a year is comparable to driving 55 km, while the impact of manufactured bottles of water consumed by an EAC in one year is equivalent to driving 272 km. Figure 1 also compares the results with the yearly total environmental impact of one EU citizen in 2019.[24] These results all come from PEF studies conducted by the relevant sectors.
The environmental footprint of a year’s worth of banknote payments by an EAC represents a very negligible fraction (0.01%) of the environmental footprint of a European’s annual overall consumption activity, which is 1,003,686 µPt. Therefore, this analysis concludes that the environmental impact of a payment with banknotes is negligible.
Figure 1
Comparison of the environmental footprints of euro banknotes and other common products

Note: A car journey equivalent is included for each.
4.3 Sources of the environmental footprint of banknotes
The largest source of the environmental impact of paying with euro banknotes is the distribution stage, which includes the transportation of banknotes and energy consumption of banknote circulation activities. This stage incorporates the multiple use of banknotes as they constantly circulate during their lifetime before reaching the end-of-life stage. Chart 1 shows the percentage contribution of each of the five stages of the PEF to the overall environmental impact score on the basis of one person paying with banknotes over a period of one year.
The percentages are outlined in Chart 1, and it is clear that the other stages contribute less. The end-of-life stage shows a positive impact in terms of the PEF as it has a negative contribution to the overall result. This is mainly owing to the use of incineration, which has energy recovery, for waste disposal.
Chart 1
Percentage contribution of each life cycle stage to the single overall score

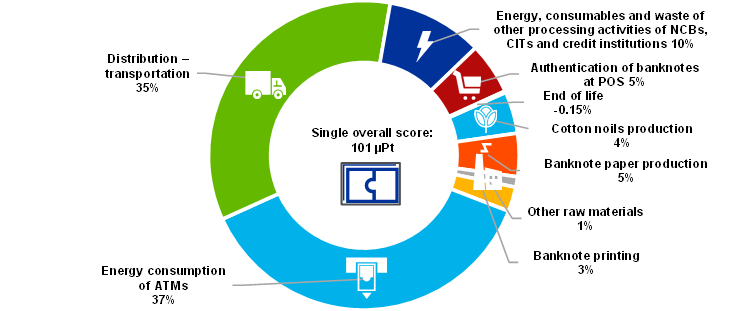
Further breaking down the results, the main activities that contribute to the single overall score are the energy consumption of ATMs (37%), transportation (35%) and energy for processing activities (10%) in the distribution stage, and paper manufacturing (9%) and energy consumption of the authentication of banknotes at POS (5%) in the use stage. These contributions are shown in Chart 2.
Chart 2
Single overall score subdivided by activities and their percentage contributions
4.4 Sensitivity analysis and the impact of the Eurosystem’s environmental policies
Sensitivity analyses were performed to assess the impact of implementing alternative choices, measure ongoing Eurosystem initiatives and explore potential actions for future improvement with regard to environmental footprint of the euro banknote.
4.4.1 The Sustainable Cotton Programme
The Sustainable Cotton Programme, which was launched in 2014 and consists of progressively substituting all conventional cotton fibres with 100% sustainable cotton fibres by the end of 2023, is projected to deliver a 3.6% reduction in the single overall score compared with before 2014 (Chart 3) once it has been fully incorporated into the production allocation for 2023, when at least 40% of the sustainable cotton fibres will be organic.[25]
In addition, a further 1% reduction in the single overall score could be achieved once the move to 100% organic cotton is complete, which is targeted for the 2027 production. With the aim to reduce the environmental impact of paper production, alternative fibres to cotton, ones with a lower environmental impact, are also being investigated.
Chart 3
Impact of the Sustainable Cotton Programme on the overall environmental footprint of the euro cash cycle
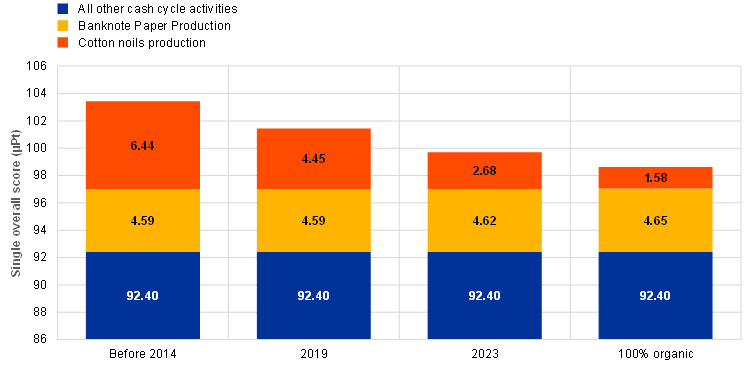
Note: Banknote paper production and all other cash cycle activities remain the same as only the composition of cotton noils was changed.
4.4.2 Energy sources
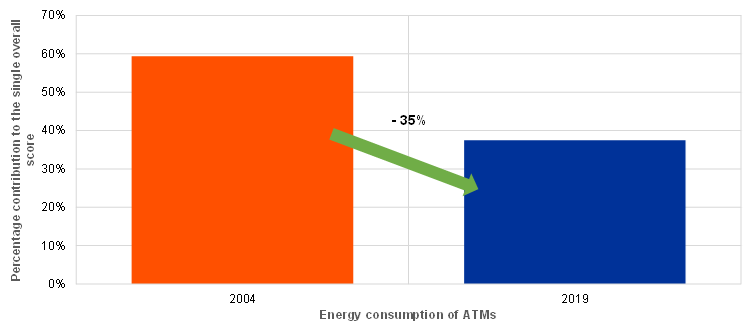
The energy consumption of ATMs has decreased significantly over the last 15 years, as shown by analyses conducted to compare the energy use of ATMs in 2019 with the energy use calculated in the 2004 LCA study on the first series of banknotes (Chart 4).[26] The energy consumption of ATMs in 2004 has been incorporated into this 2019 PEF study. Everything else being equal, the single overall score decreased by 35% between 2004 and 2019, despite the number of ATMs having significantly increased.[27] This suggests that ATMs have significantly improved in terms of energy consumption over the last 15 years.[28] This reduction could also be partly explained by the European electricity grid mix becoming increasingly green.[29]
Chart 4
Comparison of the energy consumption of ATMs as percentage contribution to the PEF single overall score
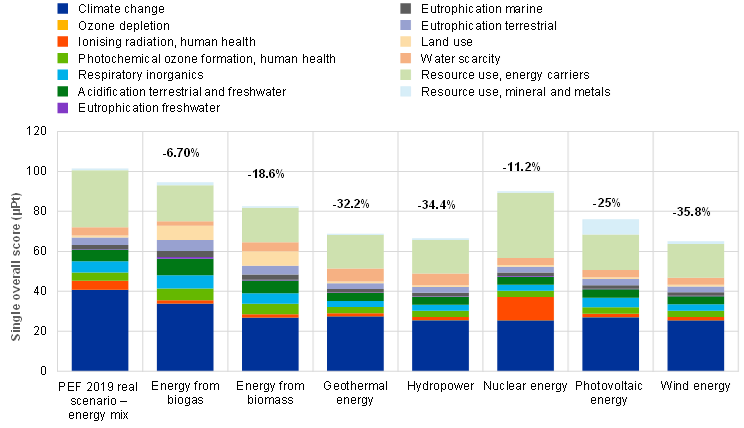
Sensitivity analyses were also conducted on energy sources for ATMs and other banknote dispensing and authentication machines to assess the impact of substituting the current energy mixes with more renewable energy sources (see Chart 5). For example, using wind-generated electricity could result in a 35% decrease in the single overall score with respect to the 2019 euro PEF results. These analyses only look at altering the source of energy supplied to ATMs and other cash dispensing machines. Another positive impact could come by using ATMs and cash dispensing machines that consume less energy.
Chart 5
Impact of the substitution of the current energy mixes for ATMs with more renewable energy sources
4.4.3 Transportation of banknotes
The transportation sector is undergoing continuous development around the world owing to technological improvement and climate change considerations. Cost and environmental considerations have already led to an optimisation of transports logistics.
Large-scale banknote transportation is organised by the NCBs of the Eurosystem and supported by third parties with trucks or planes. Taking the complexity and scale of the task into account, the ECB coordinates banknote transportation in a way that increases trip efficiency and capacity and consequently minimises the environmental impact of the activity.
The impact of transportation activities could be lowered further by using vehicles with a lower environmental impact and switching to more sustainable fuels when they become more widely available on the market. To this end, the Eurosystem is monitoring the sector and European policies for both road and air transport. Policies for the latter will be aligned to the EU targets for the use of Sustainable Aviation Fuel.
4.4.4 Waste disposal methods for end-of-life banknotes
As for waste disposal methods for the end-of-life stage (i.e. euro banknotes that are unfit for circulation), the decision to ban landfill and combustion by the end of 2022 is another Eurosystem initiative that significantly reduced the environmental impact of end-of-life euro banknotes. Chart 6 shows how the impact contribution of each disposal method changed between 2009, 2019 and 2022. The graph shows negative scores for incineration and recycling. This is down to the fact that the former involves energy recovery and the latter avoids the creation of new materials. As the proportion of landfill decreases, the overall impact of the end-of-life stage also decreases. At the same time, the increased use of incineration and recycling also contributes to the decrease of the single overall score. This life cycle stage can be further improved in the future by moving from incineration to more recycling solutions.
Chart 6
Ban on the use of landfill and combustion (with no energy recovery) as a waste disposal method (system boundaries diagram)
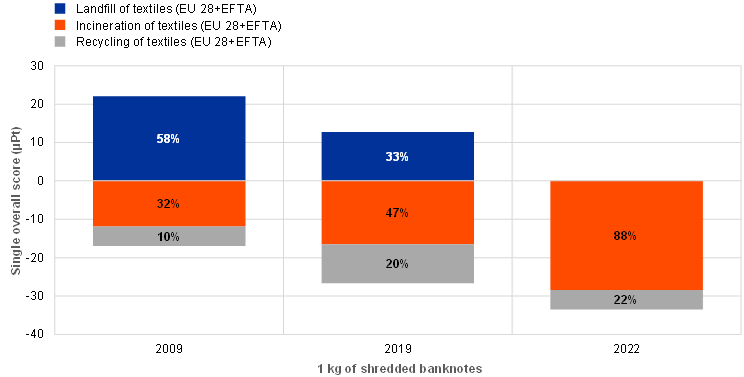
Note: “EU-28+EFTA represents the 28 countries that were part of the European Union until 2020, plus the member countries of the European Free Trade Association (EFTA).
5 Conclusion
As highlighted in its cash strategy, the Eurosystem is committed to ensuring Europeans’ freedom of choice with regard to payment instruments. Euro cash therefore has to remain available and accepted across Europe and close to where people live. To meet this demand and enable the smooth circulation of euro cash throughout the economy, an adequate infrastructure must be maintained.
The Eurosystem, aware of its social responsibility, also aims to ensure that euro banknotes are as sustainable as possible. With this in mind, we have conducted this Product Environmental Footprint (PEF) study to provide insights into the environmental impact of paying with euro banknotes and determine how this impact can be further reduced in the future.
This PEF study finds that the single overall score for the average annual value of cash payments per euro area citizen (EAC) in 2019 is 101 µPt. This very low score is equal to the impact of an EAC driving a standard car for 8 km or 0.01% of the total environmental impact of a European’s annual overall consumption activity.
The main activities contributing to the environmental footprint of banknote payments are energy consumption when dispensing banknotes to consumers via cash machines such as automated teller machines (ATMs), followed by transportation of banknotes between national central banks (NCBs), commercial cash centres, credit institutions, ATMs and retailers, and then by the activities of processing banknotes at NCBs, cash-in-transit companies (CITs) and credit institutions. Due to the long lifetime of banknotes and the fact that they are used for many payments, their production has a comparably lower share of impact compared with their transportation and distribution.
The Eurosystem has already implemented policies to make euro banknotes more sustainable, such as the Sustainable Cotton Programme and the ban on landfilling banknotes unfit for circulation. Efforts have also been made by ATM manufacturers and credit institutions to reduce the environmental impact of their machines. The energy consumption of ATMs, for instance, has already fallen by 35% between 2004 and 2019, even though ATMs have significantly increased in number. We are also looking into further reducing the impact of transportation.
Despite the low environmental impact of paying with euro banknotes and the progress already made, the Eurosystem is still committed to further improving the sustainability of euro banknotes while, at the same time, ensuring cash is widely available and accepted. Extensive research and development is under way to determine alternative waste disposal methods for banknotes, such as recycling and the reusing of waste material, and to find possible improvements to material and components used in the printing process.
To see how the results compare with those of other means of payment and possibly learn how to make further improvements to cash, it would be worth assessing the environmental footprint of other means of payment, making sure to use similar LCA methods and FUnits.
Looking ahead, people’s payment behaviour will continue to change. Nonetheless, cash will play an important role in ensuring people’s freedom with regard to choice of payment method. The Eurosystem will therefore continue to ensure that people can easily access euro cash. It will do so while actively trying to improve the environmental footprint of both the current and future series of euro banknotes. Similar or partial studies will be carried out by the Eurosystem in the future, in particular if significant changes in the cash cycle were to occur.
Annex
Annex A: Glossary[30]
Cash cycle – A network of stakeholders and physical infrastructure aimed at producing and distributing banknotes. It supports the payment function of cash in the euro area and other functions that are outside the scope of this study, such as store of value and foreign demand for euro banknotes.
Cash-in-transit companies (CITs) – Cash-in-transit companies are responsible for the physical transfer of banknotes, coins, credit cards and items of value from one location to another. Locations include cash centres and bank branches, ATM points, large retailers and other premises holding large amounts of cash, such as ticket vending machines and parking metres.
Characterisation – The calculation of the size of the contribution of each classified input/output to their respective environmental footprint impact categories, and the aggregation of the contributions within each category. This requires a linear multiplication of the inventory data with the characterisation factors for each substance and environmental footprint impact category of concern. For example, with respect to the environmental footprint impact category “climate change”, carbon dioxide (CO2) is chosen as the reference substance and kg CO2-equivalents as the reference unit.
Characterisation factor – The factor derived from a characterisation model that is applied to convert an assigned life cycle inventory result to the common unit of the environmental footprint impact category indicator (based on ISO 14040:2006).
Classification – Assigning the material/energy inputs and outputs tabulated in the life cycle inventory to environmental footprint impact categories according to each substance’s potential to contribute to each of the environmental footprint impact categories considered.
Cradle to grave – A product’s life cycle that includes the stages of raw material extraction, processing, distribution, storage, use, and disposal or recycling. All relevant inputs and outputs are considered for all of the stages of the life cycle.
Data Quality Rating (DQR) – Semi-quantitative assessment of the quality criteria of a dataset based on technological representativeness, geographical representativeness, time-related representativeness and precision. The data quality is considered as the quality of the dataset as documented.
Environmental impact – Any change to the environment, whether adverse or beneficial, that wholly or partially results from an organisation’s activities, products or services (Eco-Management and Audit Scheme regulation).
Environmental footprint – see the definition for environmental impact.
Environmental footprint impact category – The class of resource use or environmental impact to which the life cycle inventory data are related.
Environmental footprint impact assessment – The phase of Product Environmental Footprint (PEF) analysis aimed at understanding and evaluating the magnitude and significance of the potential environmental impacts for a product system throughout the life cycle of the product (based on ISO 14044:2006). The impact assessment methods provide impact characterisation factors for elementary flows to aggregate the impact and obtain a limited number of midpoint indicators.
Environmental footprint impact assessment method – The protocol for the quantitative translation of life cycle inventory data into contributions to an environmental impact of concern.
Euro area citizen (EAC) – A citizen over the age of 18 in the 19 euro area countries.[31]
Eurosystem – The euro area monetary authority that comprises the European Central Bank (ECB) and the national central banks (NCBs) of the Member States that have adopted the euro.
Functional unit (FUnit) – The functional unit defines the qualitative and quantitative aspects of the function(s) and/or service(s) provided by the product being evaluated. The functional unit definition answers the questions “what?”, “how much?”, “how well?”, and “for how long?”.
Life cycle – The consecutive and interlinked stages of a product system, from raw material acquisition or generation from natural resources to final disposal (ISO 14040:2006).
Life cycle assessment (LCA) – The compilation and evaluation of the inputs, outputs and the potential environmental impacts of a product system throughout its life cycle (ISO 14040:2006).
Life cycle inventory (LCI) – An inventory of all the material, energy and waste inputs and outputs, emissions into air and water and soil for the product supply chain compiled as a basis for modelling the PEF.
Life cycle inventory (LCI) dataset – A document or file with life cycle information of a specified product or other reference (e.g. a site or process), covering descriptive metadata and a quantitative life cycle inventory. An LCI dataset could be a partially aggregated unit process dataset or an aggregated dataset.
Normalisation – After the characterisation step, normalisation is the step in which the life cycle impact assessment results are multiplied by normalisation factors that represent the overall inventory of a reference unit (e.g. a whole country or an average citizen). Normalised life cycle impact assessment results express the relative shares of the impacts of the analysed system in terms of the total contributions to each impact category per reference unit. When displaying the normalised life cycle impact assessment results of the different impact topics next to each other, it becomes evident which impact categories are most and least affected by the analysed system. Normalised life cycle impact assessment results reflect only the contribution of the analysed system to the total impact potential, not the severity/relevance of the respective total impact. Normalised results are dimensionless, but not additive.
Notes-held-to-order (NHTO) scheme – A scheme consisting of individual contractual arrangements between an NCB and one or more entities (NHTO entities) in the NCB’s participating Member State, whereby the NCB: (i) supplies the NHTO entities with euro banknotes, which they hold outside the NCB’s premises for the purpose of putting them into circulation; and (ii) credits or directly debits the NCB account held by the NHTO entities or by the credit institutions that are customers of the NHTO entities for euro banknotes which are deposited with or withdrawn from the premises by NHTO entities or by their customers and notified to the NCB. Banknotes transferred from the NCB to NHTO entities form part of the NCB’s created banknotes. Banknotes held by NHTO entities do not form part of the NCB’s national net issuance of banknotes.
Payment methods – Retail payments are transactions between consumers, businesses and public authorities. The most common means of payment in the euro area are cash (banknote and coins), payment cards, credit transfers and direct debits.
PEF methodology – An LCA-based method used to quantify the environmental impact of products (goods and services).
PEF study – A term used to identify the totality of actions needed to calculate the PEF results. It includes modelling, data collection, and an analysis of the results. It does not include a PEF report or a verification of the PEF study and report.
Single overall score –The aggregated weighted results of each impact category summed as a single overall score. The single overall score is expressed in points or in multiples or submultiples (micropoints, µPt).
System boundary – The aspects included or excluded from the study.
Unfit banknotes - Euro banknotes that do not meet the fitness criteria and are classified by sorting machines as not fit for circulation. These banknotes are returned to the NCBs and disposed of.
Weighting – A step that supports the interpretation and communication of the results of the analysis. PEF results are multiplied by a set of weighting factors that reflect the perceived relative importance of the impact categories considered. Weighted environmental footprint results may be directly compared across impact categories and summed across impact categories to obtain a single overall score.
Annex B: The PEF impact categories – description
Environmental footprint impact categories are specific categories of impacts considered in a PEF study; they constitute the PEF impact assessment method. Each of the 16 PEF impact categories refers to a certain stand-alone characterisation model, i.e. an assessment method and unit of measure. Table 1 provides the default list of the environmental footprint impact categories and related assessment methods. In accordance with the PEF Guidance, the three toxicity-related impact categories – cancer human health, non-cancer human health and ecotoxicity freshwater – were excluded from this study owing to the low robustness in the EF 2.0 method.
Table A
Environmental footprint impact categories
Environmental footprint impact | Impact category indicator | Unit | Characterisation model | Robustness |
|---|---|---|---|---|
Climate change (total) | Radiative forcing as global warming potential (GWP100) | kg CO2 eq | Baseline model of 100 years of the IPCC (based on IPCC 2013) | I |
Ozone depletion | Ozone depletion | kg CFC-11 eq | Steady state | I |
Human | Comparative toxic unit for humans | CTUh | USEtox model 2.1 | III |
Humantoxicity (non-cancer) | CTUh | CTUh | USEtox model 2.1 (Fankte et al, 2017) | III |
Particulate matter | Impact on human | Disease incidence | PM method recommended by UNEP (UNEP 2016) | I |
Ionising | Human exposure efficiency relative to | kBq U235 eq | Human | II |
Photochemical ozone | Tropospheric ozone concentration increase | kg NMVOC eq | LOTOSEUROS model (Van | II |
Acidification | Accumulated | mol H+ eq | AE (Seppälä et al. 2006, | II |
Eutrophication (terrestrial) | AE | mol N eq | AE (Seppälä et al. 2006, | II |
Eutrophication (freshwater) | Fraction of nutrients reaching freshwater end compartment | kg P eq | EUTREND model | II |
Eutrophication (marine) | Fraction of nutrients reaching marine end compartment (N) | kg N eq | EUTREND model | II |
Ecotoxicity (freshwater) | Comparative toxic unit for ecosystems | CTUe | USEtox | III |
Land use | Soil quality index | Dimensionless (pt) | Soil quality index based on LANCA | III |
Water scarcity | User deprivation | m3 world eq | Available Water Remaining | III |
Resource | Abiotic resource depletion (ADP | kg Sb eq | CML 2002 (Guinée et al., 2002) and van Oers et al. 2002 | III |
Resource use | Abiotic resource depletion – fossil fuels (ADP-fossil) | MJ | CML 2002 (Guinée et al., 2002) and van Oers et al. 2002 | III |
Notes: Robustness refers to the underlying characterisation model in the EF 2.0 method. These scores are reported in the PEF methodology: I is the highest robustness, III is the lowest robustness. The impact categories “climate change (total)” is constituted by three subcategories: climate change (fossil); climate change (biogenic); climate change (land use and land use change). The subcategories are further described in Section 4.4.10 of the PEF methodology. The subcategories ‘climate change (fossil)’, ‘climate change (biogenic)’ and ‘climate change (land use and land use change) will be reported separately if they each show a contribution of more than 5% to the single overall score of climate change.
The environmental footprint impact categories are used as the basis to calculate the final result of the study, the single overall score. The single overall score is calculated starting from the classification of the material/energy inputs and outputs inventoried into the individual impact categories. Next, the characterisation stage calculates the size of the contribution of each classified input and output to their respective impact categories. This is carried out by multiplying the values in the LCI by the relevant characterisation factors for each impact category. The characterised results are then normalised to dimensionless values based on PEF normalisation factors. Each impact category is then multiplied by a set of weighting factors, as per the PEF method, which reflect the relative importance of the life cycle impact categories considered. This results in weighted scores expressed in points. All the weighted scores obtained per impact category are finally added together to obtain the single overall score of the study.
Annex C: The PEF impact categories – results
The PEF results presented as a single overall score can also be broken down by the relative impact that each of the individual impact categories has on the score. Figure A shows the percentage impact that each of the environmental footprint impact categories has in the euro banknote PEF study. In other words, how much each impact category contributes to the single overall score of 101 micropoints.
Figure A
Euro banknote PEF single overall score and the percentage weight per main impact categories
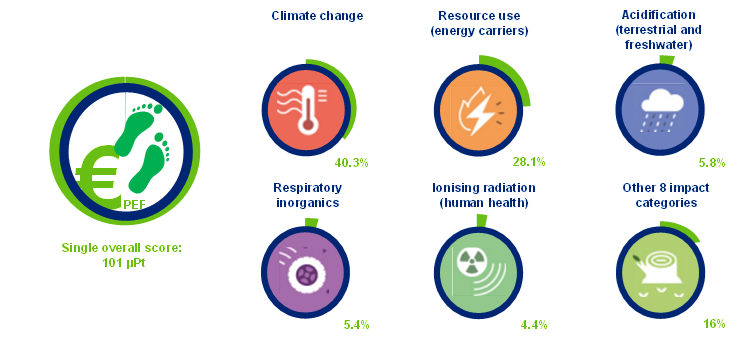
As the PEF method includes a broad scope of impact categories, it also makes it possible to focus on individual categories such as climate change, which is expressed in kg CO2-equivalent. For the climate change impact, the result of the average number of annual banknote payments by an EAC corresponds to 1.43 kg CO2-equivalent.
© European Central Bank, 2023
Postal address 60640 Frankfurt am Main, Germany
Telephone +49 69 1344 0
Website www.ecb.europa.eu
All rights reserved. Reproduction for educational and non-commercial purposes is permitted provided that the source is acknowledged.
For specific terminology please refer to the ECB glossary (available in English only).
PDF ISBN 978-92-899-6239-1, doi:10.2866/598439, QB-09-23-451-EN-N
HTML ISBN 978-92-899-6240-7, doi:10.2866/511056, QB-09-23-451-EN-Q
See “Study on the payment attitudes of consumers in the euro area (SPACE)”, ECB, Frankfurt am Main, 2022.
The Eurosystem’s cash strategy aims to ensure that cash remains widely available and accepted as both a means of payment and a store of value.
The study concerns the pre-coronavirus (COVID-19) cash cycle (i.e. 2019), thereby allowing us to use data that were not affected by COVID-19 restrictions.
This PEF study is based on the methodology of a life cycle assessment, in that it covers 16 given environmental impact categories, including climate change due to greenhouse gas emissions, ozone depletion, land and water use and resource depletion. A complete list of the impact categories covered is available in Annex A.
The Consumption Footprint Platform considers the impact of people’s consumption in the EU on the areas of food, mobility, housing, household goods and appliances.
See the T-shirt reference study included in “Product Environmental Footprint Category Rules”, European Commission, Brussels, 2022.
See the Packed Water reference study included in “Product Environmental Footprint Category Rules”, European Commission, Brussels, 2022.
The Sustainable Cotton Programme is a Eurosystem policy launched in 2014 that consists of progressively substituting conventional cotton fibres with 100% sustainable cotton fibres in the production of euro banknotes.
The energy consumption of ATMs was taken from the 2004 LCA study.
See “Study on the payment attitudes of consumers in the euro area (SPACE)”, ECB, Frankfurt am Main, 2022.
See Section 6.7 of “ECB environmental statement 2022”, ECB, Frankfurt am Main, 2022.
See “Environmental footprint methods”, European Commission, Brussels, December 2021.
A direct comparison cannot be made between this study and the LCA studies conducted by some of the national central banks (NCBs), as they have used different LCA methodologies and assessed different functions of the banknote life cycle.
The ECB would like to express its gratitude to the NCBs, the manufactures of euro banknotes and banknote equipment and the cash management companies for their invaluable input. The European Commission and its Joint Research Centre, together with individual PEF consultants, have supported the study, which has been validated by an external reviewer.
Some 29 billion banknotes in July 2023.
The data were collected in 2019, when there were still only 19 euro area countries, i.e. before Croatia joined the euro area.
Banknotes are used several times by different people. Therefore, only the proportion of banknotes that have been worn out (i.e. consumed) by a person are allocated to the FUnit.
See “Study on the payment attitudes of consumers in the euro area (SPACE)”, ECB, Frankfurt am Main, December 2023. EACs made on average 1.6 POS and peer-to-peer (P2P) transactions per day, with an average transaction value of €25.6. Cash accounted for 48% of POS and P2P payments (1.6*365*€25.6*0.48, which equates to €7,176).
Alejandro Zamora-Pérez (2021), “The paradox of banknotes: understanding the demand for cash beyond transactional use”, European Central Bank, Frankfurt am Main.
Wallets and safes are excluded because they are product independent processes (Section 4.4.7 of the European Commission’s PEF method), i.e. they have no relationship with the way the product is designed or distributed and therefore shall be excluded from the system boundary.
The average of a petrol or diesel three-to-five seater car (1.4-2.0 litre).
The PEF method requires a DQR to be performed on the study. The DQR is a semi-quantitative assessment of the quality of the datasets used based on technological, geographical and time-related representativeness, as well as precision. Five quality levels can be achieved according to DQR: poor quality, fair quality, good quality, very good quality and excellent quality.
For a more detailed explanation of the impact categories, see Annex A.
See the Consumption Footprint Platform, which has a full bottom-up approach (process-based LCA) and considers the impact of people’s consumption on the areas of food, mobility, housing, household goods and appliances. To retrieve data on the consumption footprint, go to the platform via the above link and select “Consumption Footprint”. Then, in the impact category dropdown menu, select “Single weighted score”, “2019” and “Impact per capita”.
As indicated in Table 3, euro banknotes are not produced with raw cotton but with short cotton fibres retrieved as a by-product of yarn production at ring spinning mills in the textile industry.
See “Environment, health and safety”, ECB, Frankfurt am Main, 2023.
In 2004 there were 216,000 ATMs in the euro area; in 2019 there were 311,461. Contrary to the increase of ATMs, the number of credit institution branches decreased from 177,000 at the end of 2004 to 140,000 at the end of 2019. Excluding the countries that have joined the euro area since 2004, there were 138,000 bank branches at the end of 2019.
The average annual power consumption per ATM machine was 3,995 kWh in 2004. This dropped to 1,040 kWh in 2019.
See the total energy supply for 2020.
The PEF definitions have been taken and/or adapted from the PEF methodology.
The data for the PEF study were collected in 2019, i.e. before Croatia adopted the euro.