
Economic, financial and monetary developments
Summary
At its meeting on 11 April 2024, the Governing Council decided to keep the three key ECB interest rates unchanged. The incoming information broadly confirmed the Governing Council’s previous assessment of the medium-term inflation outlook. Inflation has continued to fall, led by lower food and goods price inflation. Most measures of underlying inflation are easing, wage growth is gradually moderating, and firms are absorbing part of the rise in labour costs in their profits. Financing conditions remain restrictive and the past interest rate increases continue to weigh on demand, which is helping to push down inflation. But domestic price pressures are strong and are keeping services price inflation high.
The Governing Council is determined to ensure that inflation returns to its 2% medium-term target in a timely manner. It considers that the key ECB interest rates are at levels that are making a substantial contribution to the ongoing disinflation process. The Governing Council’s future decisions will ensure that the key ECB interest rates will stay sufficiently restrictive for as long as necessary. If the updated assessment of the inflation outlook, the dynamics of underlying inflation and the strength of monetary policy transmission were to further increase the Governing Council’s confidence that inflation is converging to its target in a sustained manner, it would be appropriate to reduce the current level of monetary policy restriction. In any event, the Governing Council will continue to follow a data-dependent and meeting-by-meeting approach to determining the appropriate level and duration of restriction, and it is not pre-committing to a particular rate path.
Economic activity
The economy remained weak in the first quarter of 2024. While spending on services is resilient, manufacturing firms are facing weak demand and production is still subdued, especially in energy-intensive sectors. Surveys point to a gradual recovery over the course of this year, led by services. This recovery is expected to be supported by rising real incomes, resulting from lower inflation, increased wages and improved terms of trade. In addition, the growth of euro area exports should pick up over the coming quarters, as the global economy recovers and spending shifts further towards tradables. Finally, monetary policy should exert less of a drag on demand over time.
The unemployment rate is at its lowest level since the start of the euro. At the same time, the tightness in the labour market continues to gradually decline, with employers posting fewer job vacancies.
Governments should continue to roll back energy-related support measures so that disinflation can proceed sustainably. Implementing the EU’s revised economic governance framework fully and without delay will help governments bring down budget deficits and debt ratios on a sustained basis. National fiscal and structural policies should be aimed at making the economy more productive and competitive, which would help to reduce price pressures in the medium term. At the European level, an effective and speedy implementation of the Next Generation EU programme and a strengthening of the Single Market would help foster innovation and increase investment in the green and digital transitions. More determined and concrete efforts to complete the banking union and the capital markets union would help mobilise the massive private investment necessary to achieve this, as the Governing Council stressed in its statement[1] of 7 March 2024.
Inflation
Inflation has continued to decline, from an annual rate of 2.6% in February to 2.4% in March, according to Eurostat’s flash estimate. Food price inflation dropped to 2.7% in March, from 3.9% in February, while energy price inflation stood at ‑1.8% in March, after ‑3.7% in the previous month. Goods price inflation fell again in March, to 1.1%, from 1.6% in February. However, services price inflation remained high in March, at 4.0%.
Most measures of underlying inflation fell further in February, confirming the picture of gradually diminishing price pressures. While domestic inflation remains high, wages and unit profits grew less strongly than anticipated in the last quarter of 2023, but unit labour costs remained high, in part reflecting weak productivity growth. More recent indicators point to further moderation in wage growth.
Inflation is expected to fluctuate around current levels in the coming months and to then decline to the 2% target next year, owing to weaker growth in labour costs, the unfolding effects of the Governing Council’s restrictive monetary policy, and the fading impact of the energy crisis and the pandemic. Measures of longer-term inflation expectations remain broadly stable, with most standing around 2%.
Risk assessment
The risks to economic growth remain tilted to the downside. Growth could be lower if the effects of monetary policy turn out stronger than expected. A weaker world economy or a further slowdown in global trade would also weigh on euro area growth. Russia’s unjustified war against Ukraine and the tragic conflict in the Middle East are major sources of geopolitical risk. This may result in firms and households becoming less confident about the future and global trade being disrupted. Growth could be higher if inflation comes down more quickly than expected and rising real incomes mean that spending increases by more than anticipated, or if the world economy grows more strongly than expected.
Upside risks to inflation include the heightened geopolitical tensions, especially in the Middle East, which could push energy prices and freight costs higher in the near term and disrupt global trade. Inflation could also turn out higher than anticipated if wages increase by more than expected or profit margins prove more resilient. By contrast, inflation may surprise on the downside if monetary policy dampens demand more than expected, or if the economic environment in the rest of the world worsens unexpectedly.
Financial and monetary conditions
Market interest rates have been broadly stable since the Governing Council’s monetary policy meeting on 7 March 2024 and wider financing conditions remain restrictive. The average interest rate on business loans edged down to 5.1% in February, from 5.2% in January. Mortgage rates were 3.8% in February, down from 3.9% in January.
Still elevated borrowing rates and associated cutbacks in investment plans led firms to further reduce their demand for loans in the first quarter of 2024, as reported in the April 2024 euro area bank lending survey. Credit standards for loans remained tight, with a further slight tightening for lending to firms and a moderate easing for mortgages.
Against this background, credit dynamics remain weak. Bank lending to firms grew marginally faster in February, at an annual rate of 0.4%, up from 0.2% in January. Growth in loans to households remained unchanged in February, at 0.3% on an annual basis. Broad money – as measured by M3 – grew at a subdued rate of 0.4% in February.
Monetary policy decisions
The interest rate on the main refinancing operations and the interest rates on the marginal lending facility and the deposit facility remain unchanged at 4.50%, 4.75% and 4.00% respectively.
The asset purchase programme portfolio is declining at a measured and predictable pace, as the Eurosystem no longer reinvests the principal payments from maturing securities.
The Governing Council intends to continue to reinvest, in full, the principal payments from maturing securities purchased under the pandemic emergency purchase programme (PEPP) during the first half of 2024. Over the second half of the year, it intends to reduce the PEPP portfolio by €7.5 billion per month on average. The Governing Council intends to discontinue reinvestments under the PEPP at the end of 2024.
The Governing Council will continue applying flexibility in reinvesting redemptions coming due in the PEPP portfolio, with a view to countering risks to the monetary policy transmission mechanism related to the pandemic.
As banks are repaying the amounts borrowed under the targeted longer-term refinancing operations, the Governing Council will regularly assess how targeted lending operations and their ongoing repayment are contributing to its monetary policy stance.
Conclusion
At its meeting on 11 April 2024, the Governing Council decided to keep the three key ECB interest rates unchanged. The Governing Council is determined to ensure that inflation returns to its 2% medium-term target in a timely manner. It considers that the key ECB interest rates are at levels that are making a substantial contribution to the ongoing disinflation process. The Governing Council’s future decisions will ensure that the key ECB interest rates will stay sufficiently restrictive for as long as necessary. If the updated assessment of the inflation outlook, the dynamics of underlying inflation and the strength of monetary policy transmission were to further increase the Governing Council’s confidence that inflation is converging to its target in a sustained manner, it would be appropriate to reduce the current level of monetary policy restriction. In any event, the Governing Council will continue to follow a data-dependent and meeting-by-meeting approach to determining the appropriate level and duration of restriction, and it is not pre-committing to a particular rate path.
In any case, the Governing Council stands ready to adjust all of its instruments within its mandate to ensure that inflation returns to its medium-term target and to preserve the smooth functioning of monetary policy transmission.
1 External environment
Global economic activity is set to improve slightly in the first quarter of 2024. Global trade is expected to gradually recover after a weak fourth quarter of last year. While the disruptions in the Red Sea persist, shipping prices started to recede and global supply chains remain resilient. Inflationary pressures remain elevated, but labour markets across advanced economies continue to cool down.
Global activity is set to recover but remain moderate in the first quarter of 2024. Indicators continue to point to improved global growth momentum early in the year, with the strongest signal coming from survey indicators. In March, the global (excluding the euro area) composite output Purchasing Managers’ Index (PMI) remained at a solid 52.6, reflecting robust manufacturing output, which was also at 52.6. Other data, however, are painting a more nuanced picture. Global retail sales weakened slightly in January in three-month-on-three-month (momentum) terms, despite a recovery in consumer confidence, while momentum in global industrial production picked up somewhat (Chart 1). Overall, both the ECB’s global growth nowcasting model and tracker suggest a modest pick-up in activity at the start of the year.
Chart 1
Global activity indicators
(retail sales and industrial production: 3-month-on-3-month percentage changes; confidence and PMI data: difference from expansion threshold)

Sources: OECD, S&P Global, Haver and ECB staff calculations.
Notes: Weighted average of 32 economies (AU, BR, BG, CA, CL, CN, CO, CZ, DK, HK, IN, ID, JP, HU, MX, MY, NZ, NO, PL, RO, RU, SG, ZA, KR, SE, CH, TW, TH, TR, UK, US, VN) covering 82% of the world excluding euro area GDP. Country indices are weighted by purchasing power parity. The latest observations are for January 2024 (retail sales and industrial production), February 2024 (consumer confidence) and March 2024 (PMI manufacturing output).
Global trade growth is also seen to recover after a weak fourth quarter of last year. Global PMI new export orders for both manufacturing and services in March indicate that growth in trade in goods and services should recover gradually in the near term. The improving momentum in global industrial production should also support trade. Post-pandemic-related factors that weighed on trade in 2023, such as the rebalancing of spending back from goods towards services and the inventory cycle correcting for an overbuild, are fading away, which should also allow global trade to gradually recover throughout 2024. Nonetheless, the disruptions to trade through the Red Sea continue to pose a significant risk. Transit volumes in that area remain at around 60% below normal as shipping companies still circumvent this route. However, shipping prices, which rose sharply in the aftermath of the Houthi attacks, are now receding, while congestion in global ports has decreased since mid-January and stands below its pre-pandemic average in March. Spare capacity in the shipping industry, weak goods demand and high manufacturers’ inventories have all cushioned the impact of longer shipping times, but an escalation of the Middle East conflict still poses a significant risk to trade and inflation.
Headline inflation across OECD economies held steady in February, while core inflation continued to ease, albeit modestly. In February, the annual headline consumer price index (CPI) inflation across OECD countries (excluding Türkiye) declined marginally to 3.1%, compared with 3.2% in the previous month (Chart 2). Excluding food and energy prices, OECD core inflation continued to slow to 3.6% in February, down 0.2 percentage points from January, amid easing labour market pressures in advanced economies. Early indicators for wages, based on online job listings, suggest that nominal wage growth has already passed its peak in advanced economies and will abate further. A declining vacancies-to-unemployment ratio across key advanced economies also points to a cooling of labour market pressures. In addition, while real wage growth turned positive in the United States and the United Kingdom in late 2023, firm-level evidence shows that firms’ mark-ups are still above their pre-pandemic levels, suggesting some room for firms to absorb rising labour costs without passing them on to consumers through higher prices. As a result, global consumer prices are expected to continue to slow gradually over the coming months across advanced economies, although inflation could prove persistent in the very short run.
Chart 2
OECD consumer price inflation
(year-on-year percentage changes)

Sources: OECD and ECB staff calculations.
Notes: The OECD aggregate excludes Türkiye and is calculated using OECD CPI annual weights. The latest observations are for February 2024.
Oil prices have increased by 5% since the March Governing Council meeting against the backdrop of geopolitical uncertainty in the Middle East. Oil prices remain sensitive to developments in the Middle East as a wider escalation of the conflict could significantly affect global oil supply. At the same time, OPEC+ extended production cuts to cover the second quarter of 2024, and the International Energy Agency revised its forecast of the oil supply-demand balance from a surplus of supply to a deficit for 2024. The increase in oil prices was dampened by weak oil demand in Europe and China. European gas prices increased by 7% but stayed below 30 EUR/MWh, as the EU enters the gas storage replenishment season at record-high storage levels of 60% of capacity. The recent uptick in gas prices was caused by disruptions to supply from Norway and the United States, while exports of liquified natural gas from Qatar have also been influenced by the Houthi attacks on ships in the Red Sea. However, European gas demand has remained historically low following weak industrial activity in gas-intensive sectors, favourable weather conditions and changes in behaviour by households and firms following the gas crisis. Non-energy commodity prices have also increased since the March Governing Council meeting. International food commodity prices were mainly driven by an unprecedented rally in cocoa prices triggered by severe supply shortages in West Africa, while grains prices increased more moderately, partly on the back of geopolitical uncertainty about supply from Russia and Ukraine. Meanwhile, metal prices increased due to supply disruptions in the copper and aluminium markets.
In the United States, activity and price developments continue to suggest a soft landing. High-frequency indicators point towards robust but decelerating economic activity in the first quarter. Consumer spending continues to support economic activity, but the delayed effects of the Federal Reserve System’s restrictive monetary policy are expected to weigh on future economic activity. Moreover, the US labour market increasingly shows signs of cooling, with wage growth moderating and the number of people voluntarily quitting their job falling. Annual headline consumer price inflation, however, increased by 0.3 percentage points to 3.5% in March as energy prices rose, while core inflation remained stable at 3.8%. Services inflation in particular is expected to decline only gradually, potentially resulting in a sluggish downward path for inflation in the months ahead. In its March meeting, the Federal Open Market Committee (FOMC) maintained policy rates at between 5.25% and 5.5%. FOMC members revised their forecast for GDP in 2024 up considerably, to 2.1% from 1.4% in fourth-quarter-over-fourth-quarter terms, mainly reflecting better-than-expected data. Revisions to the inflation outlook for this year were much smaller, up by just 0.2 percentage points.
The recovery of the Chinese economy remains mixed as the property slowdown continues to weigh on growth. Industrial activity in China, at 7.0% year-on-year, exceeded expectations in January and February, as an upswing in the global “tech cycle” drove a double-digit expansion in computer and electronic equipment manufacturing, also pushing up Chinese export growth from December. However, activity in the property market continues to fall, causing consumer confidence to linger around historically low levels. Retail sales growth decreased to 5.5% in the first two months of the year from 8.3% in the fourth quarter of 2023. As a result, the government’s GDP growth target of 5% for this year is seen as ambitious in the absence of more fiscal stimulus. Although headline inflation turned positive in February, to 0.7% year-on-year, inflationary pressures remain subdued, with producer price inflation remaining negative in February.
In Japan, inflation and wage growth are firming, prompting the Bank of Japan to end its negative interest rate policy. At the start of the year, high-frequency data suggested that consumer spending and confidence may be picking up, in part reflecting rising wages. By contrast, manufacturing activity remains weak. Headline inflation picked up in February to 2.8%, from 2.2% in the previous month, largely reflecting base effects linked to last year’s energy subsidies. Nevertheless, the first results of the annual spring wage negotiations showed an overall wage increase of 5.3%, the strongest in 33 years, which will further support wage growth in 2024. On 19 March, the Bank of Japan (BoJ) decided to formally end its negative interest rate policy and stop other monetary easing measures. The BoJ raised its uncollateralised overnight call rate to between 0% and 0.1%, which was the first rate increase by the Japanese central bank in 17 years. The decision reflected the BoJ’s view that after a sustained period of below-target inflation, there is stronger evidence of a virtuous cycle between rising wages and prices, increasing confidence that the BoJ will achieve its 2% price stability target over the course of its projection horizon.
Indicators signal a short-term rebound in the growth momentum of the United Kingdom. After a largely stagnating GDP in 2023, surveys now indicate a moderate but consistent improvement in the outlook for activity. The recovery in GDP started in January (+0.2% month-on-month) and was supported by services and construction, while manufacturing output continued to shrink. UK headline CPI inflation declined in February, dropping to 3.4% from 4.0% in January, largely on account of a decrease in food price inflation. Core inflation also fell, to 4.5% in February from 5.1% in January, reflecting declines in both core goods and services inflation. The latter remains elevated and broad-based though, as more than a third of services items continue to grow at a rate above 8%. The Bank of England expects services inflation to fall from the current 7% to around 5% over the course of 2024. Moreover, the labour market has continued to loosen but remains relatively tight by historical standards. While looser labour market conditions and falling short-term inflation expectations point to a continued easing of wage pressures, survey data indicate that firms’ expectations for wage growth remain high and above the Bank of England’s expectations.
2 Economic activity
Economic activity in the euro area was essentially stagnant throughout 2023, amid tight financing conditions, subdued confidence and past loss of competitiveness. At the same time, jobs continued to be created during the year. Real GDP growth is expected to have remained subdued in the first quarter of 2024, given the persistent divergence between a struggling manufacturing sector and a more resilient services sector. Nevertheless, there are tentative signs of a gradual pick-up in growth later in the year. This recovery is expected to be supported by rising real incomes, resulting from lower inflation, increased wages and improved terms of trade. In addition, demand for euro area exports should rise in the coming quarters, and the dampening effect of past interest rate increases should gradually fade over time.
Euro area real GDP growth was flat in the fourth quarter of 2023, marking a fifth consecutive quarter of essentially stagnant economic activity.[2] This outcome brought GDP growth in 2023 to a modest 0.4% (not adjusted for working days), down from 3.4% in 2022. Domestic demand contributed positively to growth in the fourth quarter of last year, while net trade made a negative contribution and changes in inventories had a slight dampening effect (Chart 3). The euro area outcome and the composition of growth were affected by a steep decline in Irish GDP (-3.4% in the fourth quarter of 2023) caused by developments in the multinational-dominated sectors. Excluding Ireland, euro area GDP growth was 0.1% in the fourth quarter of 2023. Moreover, the largest euro area economies recorded markedly different growth rates, with GDP rising in Spain (0.6%), the Netherlands (0.3%), Italy (0.2%) and France (0.1%), but declining in Germany (-0.3%).
Chart 3
Euro area real GDP and its components
(quarter-on-quarter percentage changes; percentage point contributions)

Sources: Eurostat and ECB calculations.
Note: The latest observations are for the fourth quarter of 2023.
The available indicators suggest that growth remained weak in the first quarter of 2024; however, surveys point to a gradual recovery over the course of this year, led by services. The composite output Purchasing Managers’ Index (PMI) showed successive month-on-month improvements over the first quarter of 2024, reaching 50.3 in March, just above the growth threshold of 50. This suggests that the euro area economy is likely to have stagnated once again in the first quarter, but it also shows tentative signs of bottoming out. The improvement in the March PMI was mostly driven by the robust increase in services business activity (Chart 4). The manufacturing output PMI displayed positive momentum in March, but remained in negative growth territory, suggesting that the manufacturing sector continued to act as a drag on euro area output growth in the first quarter. The main findings from the ECB’s recent contacts with non-financial companies point to a subdued start to the year, especially for the manufacturing sector, with some industries adversely affected by strikes and shipping delays. Nevertheless, there are also reports of the recent destocking cycle coming to an end and of a small increase in demand for manufactured goods (see Box 5). These signs of slightly improving growth dynamics going forward are corroborated by the rise in the European Commission’s Economic Sentiment Indicator in March, following two months of decline. This improvement in confidence was broad-based across sectors. In addition, the PMI indicator of expectations for future activity (12-months ahead) rose further in March to reach its pre-pandemic average, suggesting that purchasing managers still expect a steady economic recovery this year.
Chart 4
PMI indicators across sectors of the economy
a) Manufacturing | b) Services |
|---|---|
(diffusion indices) | (diffusion indices) |
 | 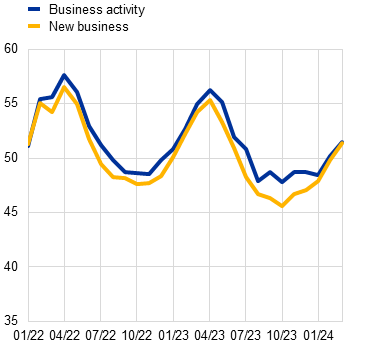 |
Source: S&P Global Market Intelligence.
Note: The latest observations are for March 2024.
The unemployment rate is at its lowest level since the start of the euro; at the same time, the tightness in the labour market continues to gradually decline, with employers posting fewer job vacancies. Employment rose by 0.3% in the fourth quarter of 2023, on the back of increases in labour force participation rates and population growth. Average working hours of persons employed decreased slightly in the fourth quarter, by 0.1%, after declining by 0.3% in the third quarter. Thus, the rise in employment has not been accompanied by an increase in working hours. While the labour force continued to grow, the unemployment rate remained at its lowest level since the euro was introduced, standing at 6.5% in February 2024, unchanged from its level in January (Chart 5). Recent short-term indicators, including the PMI employment indicator for the euro area economy, continue to suggest moderate growth in job creation in the first quarter of 2024. The PMI for employment stood at 50.9 in March, slightly above its neutral value of 50. With regard to the different sectors, the PMI for employment has declined in the manufacturing sector but has seen a further moderate increase in the services sector. The PMI composite employment indicator improved slightly during the first quarter of 2024, compared with the fourth quarter of 2023, but overall it has followed a downward trend since April 2023.
Chart 5
Euro area employment, the PMI assessment of employment and the unemployment rate
(left-hand scale: quarter-on-quarter percentage changes, diffusion index; right-hand scale: percentages of the labour force)

Sources: Eurostat, S&P Global Market Intelligence and ECB calculations.
Notes: The two lines indicate monthly developments; the bars show quarterly data. The PMI is expressed in terms of the deviation from 50 divided by 10. The latest observations are for the fourth quarter of 2023 for employment, March 2024 for the PMI assessment of employment and February 2024 for the unemployment rate.
Private consumption grew marginally at the end of 2023 and is likely to have remained weak in the first quarter of 2024, reflecting continued subdued consumption of goods. The weak growth in private consumption in the fourth quarter of 2023 (0.1% quarter on quarter) masked a marginal increase in the consumption of services, while the consumption of goods contracted further. Incoming data continue to signal overall weakness in spending on goods in the first quarter of 2024. The weakness in retail sales volumes and car sales persists, with both items remaining below their fourth-quarter 2023 levels on average in January and February. The European Commission’s consumer confidence indicator improved further in March but is still somewhat below its long-term average. The Commission’s indicators for expected retail trade business and expected major purchases by consumers were once again subdued in March. By contrast, expected demand for contact-intensive services improved further and was once again in positive growth territory (Chart 6). The ECB’s Consumer Expectations Survey (CES) for February continues to signal resilience in expected demand for holiday bookings and a gradual increase in the propensity to spend on durable goods. So far, the labour market has remained resilient, with real disposable incomes increasing in the fourth quarter of 2023, amid declining inflation and robust nominal wage growth. Further improvements in purchasing power should act as a tailwind that gathers strength over the course of 2024 and support the recovery in consumer spending.
Chart 6
Private consumption, business expectations for retail trade and expected demand for contact-intensive services
(quarter-on-quarter percentage changes; net percentage balances)
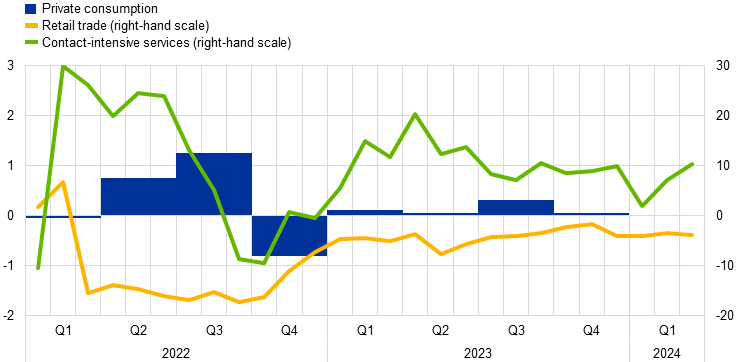
Sources: Eurostat, European Commission and ECB calculations.
Notes: Business expectations for retail trade and expected demand for contact-intensive services for the next three months refer to net percentage balances; “contact-intensive services” refers to accommodation, travel and food services. The latest observations are for the fourth quarter of 2023 for private consumption and March 2024 for business expectations for retail trade and expected demand for contact-intensive services.
Business investment contracted sharply in the fourth quarter of 2023 and is expected to have remained weak at the start of 2024. Modified non-construction investment (excluding Irish intangibles) fell by 1.7% quarter on quarter in the fourth quarter of 2023 (Chart 7, panel a). The underlying fall reflects a strong contraction in machinery and equipment investment (mainly in Germany) and a more generalised decline in transport equipment. Investment is expected to have remained weak in the first quarter of 2024, with industrial production in the capital goods sector (excluding Ireland) declining sharply in January (by 2.6% compared with the fourth quarter of 2023). Confidence among producers of capital goods fell throughout the first quarter, as output, outstanding business and new orders stayed deep in negative territory, according to PMI data, and financing conditions were restrictive. The ECB’s April 2024 bank lending survey and the ECB’s survey on the access to finance of enterprises in the euro area both point to ongoing weakness in fixed investment in the first quarter. ECB contacts with non-financial companies suggest that investment is likely to remain low for the first half of 2024 but should pick up later in the year to the extent that demand strengthens as expected (see Box 5). In addition, delayed disbursements of Next Generation EU funds are likely to help crowd in additional business investment related to the green and digital transitions ahead.
Chart 7
Real investment dynamics and survey data
a) Business investment | b) Housing investment |
|---|---|
(quarter-on-quarter percentage changes; percentage balances and diffusion indices) | (quarter-on-quarter percentage changes; percentage balances and diffusion index) |
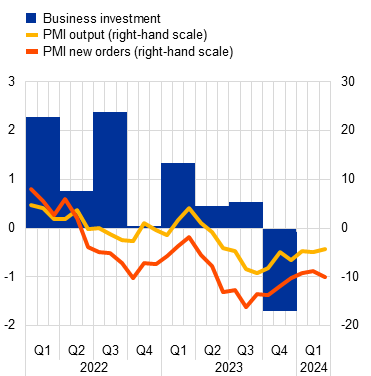 | 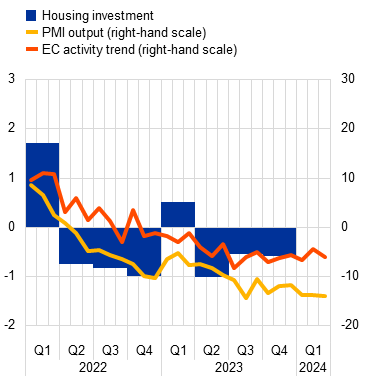 |
Sources: Eurostat, European Commission (EC), S&P Global Market Intelligence and ECB calculations.
Notes: Lines indicate monthly developments, while bars refer to quarterly data. The PMIs are expressed in terms of the deviation from 50. In panel a), business investment is measured by non-construction investment excluding Irish intangibles. The lines refer to responses from the capital goods sector. The latest observations are for the fourth quarter of 2023 for business investment and March 2024 for the PMIs. In panel b), the line for the European Commission’s activity trend indicator refers to the building construction sector’s assessment of the trend in activity compared with the preceding three months. The latest observations are for the fourth quarter of 2023 for housing investment and March 2024 for the European Commission survey and the PMIs.
Housing investment declined once again in the fourth quarter of 2023 and likely also contracted in the first quarter of 2024. Housing investment fell by 0.6% in the fourth quarter of 2023 and by 2.3% in the year as a whole. More recently, building construction output dropped by 1.5% in January 2024 compared with its average level in the fourth quarter of 2023. In addition, survey-based activity measures, such as the European Commission’s indicator for building construction activity in the last three months and the PMI for residential construction output, have remained in contractionary territory up to March (Chart 7, panel b). According to the European Commission’s business and consumer survey on factors limiting construction activity, insufficient demand was cited by firms more frequently in the first quarter of 2024 than in the fourth quarter of 2023. This was once again the most mentioned factor, followed by labour shortages. Residential building permits increased slightly in the fourth quarter of 2023 after six quarters of decline. Overall, these developments suggest that momentum in housing investment is likely to remain weak in the near future, consistent with subdued lending for house purchase. This weak outlook for housing investment is linked to the considerable rise in the cost of owning and living in a home since the start of the recent monetary tightening cycle, which is likely to weigh further on housing demand (see Box 4). The increase in the housing cost burden is also evident from CES data, which show that more households expected to make late payments on their rent, mortgage or utility bills in the first quarter of 2024 than in 2023 (see Box 3).
Euro area exports are showing tentative signs of recovery. Extra-euro area goods export volumes increased by 0.6% in January 2024 in three-month-on-three-month terms, supported by the recovery in global demand. The gradual easing of some price competitiveness challenges, amid falling energy prices and the fading effects of the euro’s appreciation last year, has provided additional support to export growth. In the near term, forward-looking indicators – for exports of both goods and services – suggest that the recovery in exports could continue, but may be subdued. Extra-euro area goods import volumes contracted once again, by 1.9%, in three-month-on-three-month terms. This reflects the ongoing sluggish activity and a destocking of inventories in the euro area.
In summary, despite a weak start to the year, activity in the euro area economy is still expected to improve over the course of 2024. GDP growth should strengthen gradually, as declining inflation and robust wage growth are expected to underpin further increases in real disposable incomes, and thus in private consumption. In addition, euro area exports should pick up in parallel with improvements in global growth. Finally, monetary policy should exert less of a drag on demand over time.
3 Prices and costs
Euro area headline inflation declined to 2.4% in March from 2.6% in February 2024. Inflation excluding energy and food declined, from 3.1% in February to 2.9% in March, driven by the decline in goods inflation but concealing unchanged high services inflation. Most measures of underlying inflation have been decreasing, confirming the picture of gradually diminishing price pressures. Wage growth eased in the fourth quarter of 2023, and while unit labour costs growth remained high, in part reflecting weak productivity growth, firms are absorbing part of the rise in labour costs in their profits. Measures of longer-term inflation expectations mostly stand at around 2%, while measures of shorter-term inflation expectations have decreased.
According to Eurostat’s flash estimate, euro area headline HICP inflation declined to 2.4% in March from 2.6% in February (Chart 8). The decrease was driven by lower rates of food and non-energy industrial goods (NEIG) inflation. The disinflation in headline inflation is continuing gradually, reflecting the declining growth rates for food and NEIG. The lower growth rate for NEIG stems from the continued easing of pipeline price pressures, despite some increase in energy inflation largely driven by base effects.
Chart 8
Headline inflation and its main components
(annual percentage changes; percentage point contributions)

Sources: Eurostat and ECB calculations.
Note: The latest observations are for March 2024 (flash estimate).
Energy inflation, although still negative, increased from -3.7% in February to ‑1.8% in March. The main drivers of the less negative annual rate of change were an upward base effect and a small impact from the reversal of compensatory measures. The latter partly reflects the postponing of the reversal of the cut in VAT on gas and heat energy in Germany.
Food inflation weakened further, falling to 2.7% in March from 3.9% in February (Chart 9). The decrease in the annual rate was observed for both main components, processed and unprocessed food, but was stronger for unprocessed food. Processed food inflation dropped to 3.6% in March from 4.5% in February. This drop reflects declines in energy costs and food commodity prices as measured by, for instance, euro area farm gate prices. Unprocessed food price inflation decreased significantly from 2.1% in February to -0.4% in March. The decline in the annual rate of inflation for unprocessed food was also due to a negative base effect associated with last year’s elevated price dynamics.
HICP inflation excluding energy and food (HICPX) decreased further from 3.1% in February to 2.9% in March. In terms of components, NEIG inflation declined from 1.6% to 1.1%, reflecting the gradually fading impact of past shocks. Services inflation was unchanged, for the fifth consecutive month, at 4.0% in March. The relatively greater persistence in services inflation is in line with strong wage growth and the more prominent role that labour costs play in the production of services.
Chart 9
Energy and food input costs, and HICP food prices
(annual percentage changes)

Source: Eurostat.
Note: The latest observations are for March 2024 (flash estimate) for HICP food inflation and February 2024 for the other data.
Producer price pressures continued to ease across all main goods categories (Chart 10). At the early stages of the pricing chain, producer price inflation for domestic sales of intermediate goods was negative (-5.3% in February, after -5.4% in January). At the later stages of the pricing chain, the annual growth rates of producer prices for non-food consumer goods continued to decline to 0.7% in February, down from 1.0% in January, reaching the lowest level since February 2021. The same unwinding tendencies hold for producer prices in the manufactured consumer goods segment with producer prices entering negative territory (-0.4% in February, down from 0.2% in January), confirming the general gradual easing of pipeline pressures on consumer goods prices. The annual growth rates of import prices have been negative since mid-2023, converging with those of domestic producer prices to contribute to subdued price pressures.
Chart 10
Indicators of pipeline pressures
(annual percentage changes)

Sources: Eurostat and ECB calculations.
Note: The latest observations are for January 2024 for import prices and February 2024 for domestic producer prices.
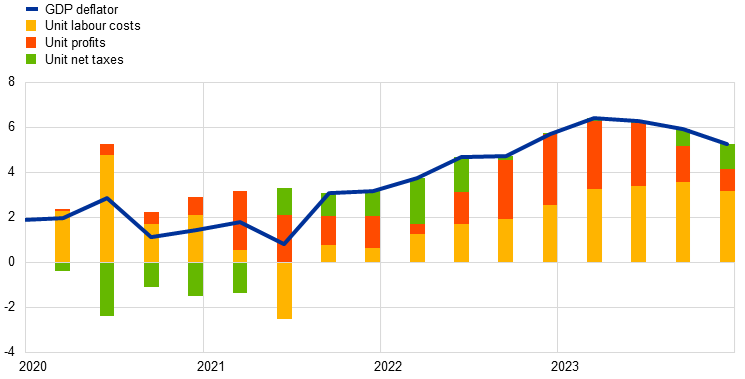
Domestic cost pressures, as measured by growth in the GDP deflator, decreased to 5.3% in the fourth quarter of 2023, down from 5.9% in the previous quarter, owing to a smaller contribution from unit profits and unit labour costs (Chart 11). After a peak of 6.4% in the first quarter of 2023, the annual growth rate of the GDP deflator eased further. The decline in the fourth quarter of 2023 was mainly driven by the decrease in unit profits growth, with their contribution going down to 1.0 percentage points, from 1.6 percentage points in the previous quarter. Similarly, the contribution of unit labour costs also decreased further to 3.2 percentage points, from 3.6 percentage points in the previous quarter. Nevertheless, labour costs are still the main contributor to domestic price pressures. Meanwhile, the contribution from unit net taxes saw an uptick in the fourth quarter of 2023, from 0.8 percentage points to 1.1 percentage points.
Chart 11
Breakdown of the GDP deflator
(annual percentage changes; percentage point contributions)
Sources: Eurostat and ECB calculations.
Notes: The latest observations are for the fourth quarter of 2023. Compensation per employee contributes positively to changes in unit labour costs and labour productivity contributes negatively.
Wage pressures eased somewhat at the end of 2023 and are expected to moderate further in 2024. The latest available data refer to the fourth quarter of 2023 and show a decrease in the annual growth rate of negotiated wages to 4.5%, down from 4.7% in the third quarter of 2023. Actual wage growth, as measured by compensation per employee and compensation per hour, decreased in the fourth quarter of 2023 to 4.6% and 4.4% respectively, down from 5.1% and 5.0% in the third quarter. The forward-looking wage trackers signal continued high but moderating wage pressures. Information on wage agreements that has become available since the end of last year implied that average negotiated wage growth in 2024 was successively lower in all active wage contracts, including one-offs, from 4.4% at the time of the January Governing Council meeting to 4.2% at the March meeting and 4.1% at the April meeting.[3]
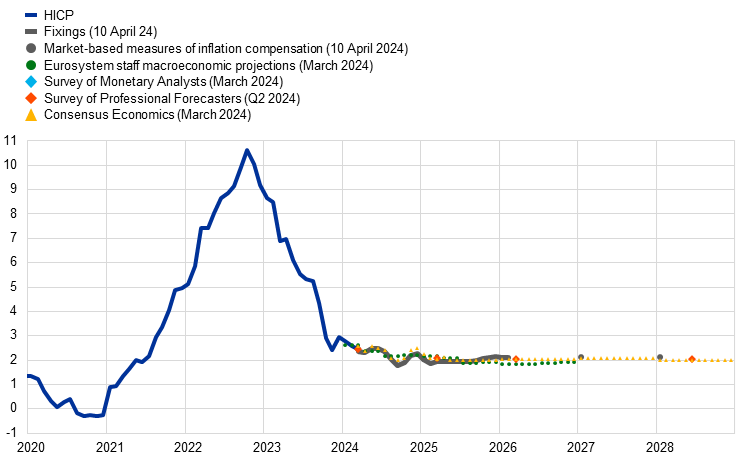
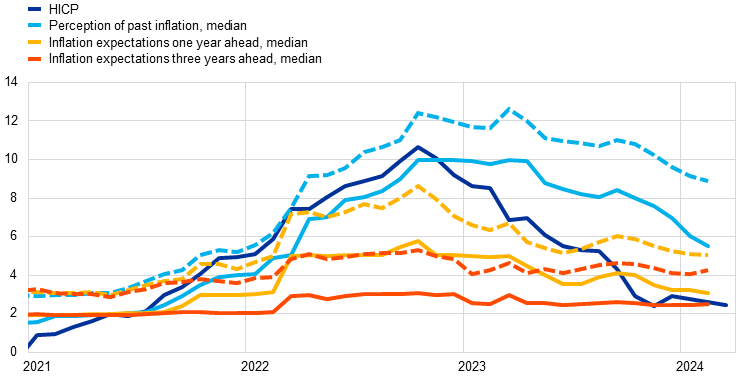
Survey-based indicators of longer-term inflation expectations and market-based measures of inflation compensation were also broadly unchanged, with most standing at around 2.0% (Chart 12). In both the ECB Survey of Professional Forecasters for the second quarter of 2024 and the March 2024 ECB Survey of Monetary Analysts, average longer-term inflation expectations (for 2028) stood at 2.0%. Market-based measures of inflation compensation (based on the HICP excluding tobacco) at the longer end of the yield curve edged up mildly, with the five‑year forward inflation-linked swap rate five years ahead standing at around 2.3%. While these market‑based measures of inflation compensation include inflation risk premia and therefore do not directly gauge the genuine inflation expectations of market participants, model-based estimates of genuine inflation expectations, excluding inflation risk premia, indicate that market participants expect inflation to be around 2.0% in the longer term. Market-based measures of near-term euro area inflation outcomes suggest that investors expect inflation to decline further in 2024, standing on average at 2.0% in the second half of the year. The one-year forward inflation-linked swap rate one year ahead was broadly unchanged over the review period, standing at 2.1%. On the consumer side, the February 2024 ECB Consumer Expectations Survey reported that median expectations for headline inflation over the next year have declined to 3.1%, compared with 3.3% in January, while inflation expectations for three years ahead have remained unchanged at 2.5%.
Chart 12
Headline inflation, inflation projections and expectations
a) Headline inflation, survey-based indicators of inflation expectations, inflation projections and market-based measures of inflation compensation
(annual percentage changes)
b) Headline inflation and ECB Consumer Expectations Survey
(annual percentage changes)
Sources: Eurostat, Refinitiv, Consensus Economics, CES, SPF, SMA, March 2024 ECB staff macroeconomic projections and ECB calculations.
Notes: The market-based measures of inflation compensation series are based on the one-year spot inflation rate, the one-year forward rate one year ahead, the one-year forward rate two years ahead and the one-year forward rate three years ahead. The observations for market-based measures of inflation compensation are for 7 March 2024. Inflation fixings are swap contracts linked to specific monthly releases in euro area year-on-year HICP inflation excluding tobacco. The SPF for the second quarter of 2024 was conducted between 18 and 21 March 2024. The cut-off date for the Consensus Economics long-term forecasts was January 2024. For the CES, dashed lines represent the mean and solid lines the median. The cut-off date for data included in the ECB staff macroeconomic projections was 9 February 2024. The latest observations are for March 2024 (flash estimate) for HICP and February 2024 for CES.
4 Financial market developments
Over the review period from 7 March to 10 April 2024, developments in euro area financial markets were relatively contained, and the market focus remained on the pace of disinflation and the timing of monetary policy adjustments. Following the Governing Council’s widely expected monetary policy decision in March 2024 to leave the key ECB policy rates unchanged, the short end of the euro area risk-free yield curve fluctuated only marginally over the review period. This reflected a firming-up of market participants’ expectations that ECB policy rates would remain unchanged at the April meeting and that the first rate cut would occur at the June meeting. Further ahead, option-implied volatility of policy rate expectations declined but remained at elevated levels. Across the euro area, sovereign bond yields moved broadly in line with risk-free rates, which picked up somewhat, amid a mild increase in sovereign spreads. Euro area equity prices increased, in particular for financial corporations, on the back of favourable risk sentiment globally and a resulting lower equity risk premium. Corporate bond spreads in the euro area showed some divergence as investment-grade spreads narrowed slightly while high-yield spreads widened amid a stagnating economy. In foreign exchange markets the euro was broadly stable in trade-weighted terms.
Euro area near-term risk-free rates had remained stable throughout the review period since the March meeting of the Governing Council. The euro short-term rate (€STR) averaged 3.91% over the review period. Excess liquidity decreased by around €244 billion to stand at €3,255 billion. This decrease mainly reflected repayments of the third series of targeted longer-term refinancing operations (TLTRO III) and the decline in the asset purchase programme (APP) portfolio, as the Eurosystem no longer reinvests the principal payments from maturing securities under this portfolio. The overnight index swap (OIS) forward curve, which is based on the €STR, remained stable for short-term maturities of up to one year following the Governing Council’s widely expected decision in March to keep the key ECB policy rates unchanged. The option-implied volatility of short-term forward rates declined but remained at elevated levels as markets continued to focus on the pace of disinflation and the timing of monetary policy adjustments. Overall, markets priced out any remaining probability of a rate cut by the ECB in April 2024 and affirmed their expectations that the first cut might occur in June. At the end of the review period, markets had priced in a rate cut of 20 basis points for June and cumulative rate cuts of 78 basis points by the end of 2024. Longer-term euro area risk-free rates increased mildly during the review period. For example, the ten-year nominal euro area risk-free rate edged up to 2.7%, ending the review period with an overall increase of 10 basis points.
Long-term sovereign bond yields moved broadly in line with risk-free rates amid a mild increase in sovereign spreads (Chart 13). The ten-year GDP-weighted euro area sovereign bond yield closed the review period at around 2.9%, 14 basis points higher than at the beginning of the review period, implying that the spread over the ten-year euro area risk-free rate had widened by 5 basis points. This widening of the GDP-weighted spread not only reflected spread movements observed in most euro area jurisdictions, it was also the result of a narrowing negative German spread. Overall, sovereign spread movements across euro area jurisdictions were limited throughout the review period, as record high net issuances so far this year were met with high levels of demand from investors. Similar to the euro area long-term rate, the ten-year UK sovereign bond yield increased by 16 basis points, but to a higher level of 4.2%. In contrast, the ten-year US Treasury yield increased significantly, by 46 basis points, to reach 4.6%.
Chart 13
Ten-year sovereign bond yields and the ten-year OIS rate based on the €STR
(percentages per annum)

Sources: LSEG and ECB calculations.
Notes: The vertical grey line denotes the start of the review period on 7 March 2024. The latest observations are for 10 April 2024.
Euro area corporate bond spreads diverged somewhat as investment-grade spreads narrowed slightly and high-yield spreads widened. By the end of the review period, spreads for investment-grade firms had narrowed slightly, continuing the trend seen over the past year and in line with the overall corporate bond market in the United States. By contrast, spreads of euro area firms in the high-yield segment had widened by 32 basis points amid a stagnating economy but remained at compressed levels overall.
Euro area equity prices increased, in particular for financial corporations, as risk sentiment was favourable globally, resulting in a lower equity risk premium. Over the review period, broad stock market indices in the euro area increased by 1.1% amid favourable risk sentiment, whereas their US counterparts remained broadly stable. Equity price gains in the euro area were notably pronounced in the financial sector. The outperformance of euro area financial stocks compensated for their underperformance earlier in the year. This improvement was the result of declining concern about the risk exposure of the banking sector as a whole to commercial real estate. On net, the equity prices of euro area non-financial corporations remained unchanged, while the equity prices of euro area banks and of other financial corporations increased by 9.8% and 6.2% respectively. In the United States, equity prices also remained unchanged for non-financial corporations and increased by 1.7% for banks and by 1.0% for other financial corporations.
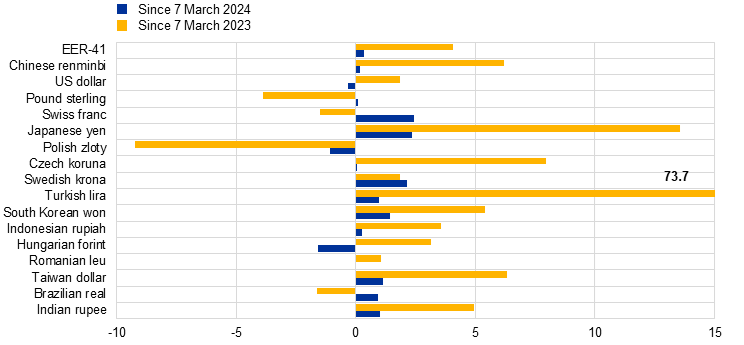
In foreign exchange markets, the euro was broadly stable in trade-weighted terms (Chart 14). During the review period, the nominal effective exchange rate of the euro – as measured against the currencies of 41 of the euro area’s most important trading partners – was broadly stable (+0.3%). A small depreciation against the US dollar (-0.3%) was more than compensated for by an appreciation against other major currencies. The stability of the euro against the US dollar came following initial upward pressure on the US dollar due to market expectations of tighter-for-longer US monetary policy. This pressure was partly reversed after the March Federal Open Market Committee meeting reassured markets that the Federal Reserve System still plans to cut rates at a similar pace this year. In terms of bilateral exchange rate movements against other major currencies, the euro appreciated against the Swedish krona (by 2.1%), the Swiss franc (by 2.4%), as the Swiss National Bank decided to cut rates, and the Japanese yen (by 2.4%), despite the Bank of Japan deciding to raise interest rates, as the decision had been widely anticipated by markets.
Chart 14
Changes in the exchange rate of the euro vis-à-vis selected currencies
(percentage changes)
Source: ECB calculations.
Notes: EER-41 is the nominal effective exchange rate of the euro against the currencies of 41 of the euro area’s most important trading partners. A positive (negative) change corresponds to an appreciation (depreciation) of the euro. All changes have been calculated using the foreign exchange rates prevailing on 10 April 2024.
5 Financing conditions and credit developments
In February 2024 composite bank funding costs and bank lending rates remained high. The cost to non-financial corporations (NFCs) of market-based debt remained virtually unchanged over the period from 7 March to 10 April 2024, while the cost of equity declined. In the April 2024 euro area bank lending survey, banks reported broadly unchanged credit standards in the first quarter of 2024. Loan demand from firms declined substantially, contrary to bank expectations of a recovery. In February bank lending remained weak overall, despite the moderate increase in the annual growth rate of lending to firms, and lending to households remained broadly stable at levels marginally above zero. In the Survey on the Access to Finance of Enterprises for the first quarter of 2024, firms reported a modest reduction in their need for bank loans, along with a smaller decline in the availability of bank loans. The annual growth rate of broad money (M3) rose but remained low, driven by high opportunity costs, stagnant lending and the reduction in the Eurosystem balance sheet.
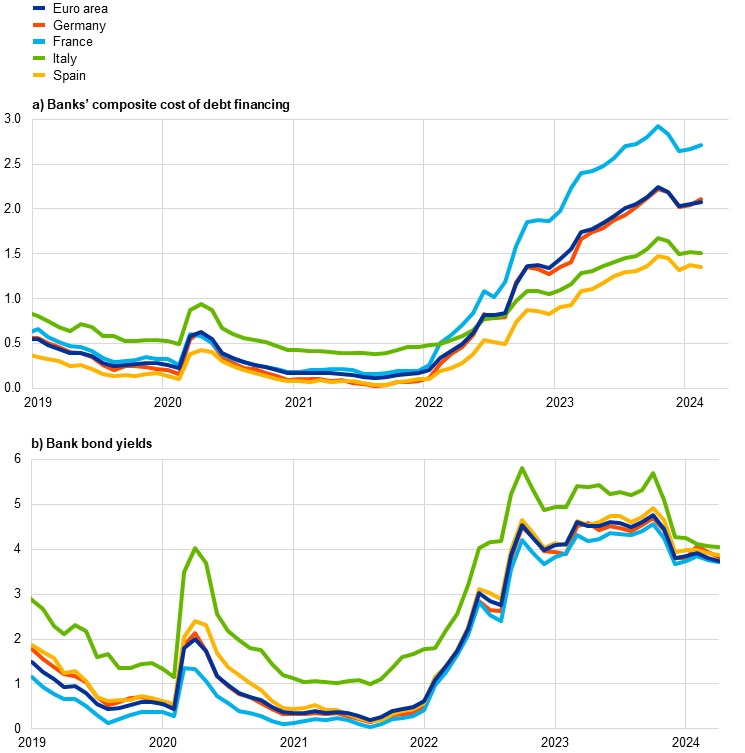
Euro area bank funding costs remained high by historical standards. In February 2024 the composite cost of debt financing for euro area banks stood at 2.08%, slightly below its recent peak of 2.24% in October 2023 (Chart 15, panel a). This was driven by ongoing shifts towards more expensive funding sources and slightly higher bank bond yields in February 2024, amid considerable cross-country heterogeneity and increased volatility (Chart 15, panel b). Deposit rates remained broadly unchanged, with variation across instruments and sectors. Rates on overnight deposits remained stable in February, while rates on time deposits fell, resulting in a slight narrowing of the large spread between the two. At the same time, rates on deposits redeemable at a period of notice of up to three months continued to rise.
Central bank lending operations continue to decline smoothly, contributing to higher bank funding costs. Banks have made sizeable repayments (both mandatory and, in particular, voluntary) of funds borrowed under the targeted longer-term refinancing operations (TLTROs). On 27 March 2024 repayments of €251 billion were made on the third series of operations (TLTRO III). A total of €1.972 trillion TLTRO III funds have been repaid since the recalibration of the terms and conditions came into effect on 23 November 2022, amounting to a 93% reduction in outstanding amounts.[4] Amid the winding-down of TLTROs and the decline in deposits, banks have increased their issuance of bonds, which are remunerated above deposit and policy rates.
Chart 15
Composite bank funding costs in selected euro area countries
(annual percentages)
Sources: ECB, S&P Dow Jones Indices LLC and/or its affiliates, and ECB calculations.
Notes: Composite bank funding costs are a weighted average of the composite cost of deposits and unsecured market-based debt financing. The composite cost of deposits is calculated as an average of new business rates on overnight deposits, deposits with an agreed maturity and deposits redeemable at notice, weighted by their respective outstanding amounts. Bank bond yields are monthly averages for senior tranche bonds. The latest observations are for February 2024 for banks’ composite cost of debt financing and for 4 April 2024 for bank bond yields.
Bank balance sheets have been robust overall, despite a weak economic environment. In the fourth quarter of 2023 banks continued to increase their capitalisation and maintained capital ratios well above Common Equity Tier 1 (CET1) requirements. A well-capitalised banking system is key to ensuring the sustainable provision of credit to the real economy under adequate conditions. Against a backdrop of high bank funding costs, stagnant loan growth and worsening asset quality, bank profitability over the last year was mainly driven by net interest rate income, reflecting wide interest rate margins and with considerable cross-country heterogeneity. Loan-deposit margins on new business continued their broad-based decline across euro area countries, while margins on outstanding amounts remained broadly stable. Overall, bank non-performing loans remained at low levels in the fourth quarter of 2023, but default rates on both corporate and retail exposures are on the rise, pointing to further increases in non-performing loans. Banks may face higher provisioning costs if risks to the non-financial sectors materialise as a result of weak economic conditions.
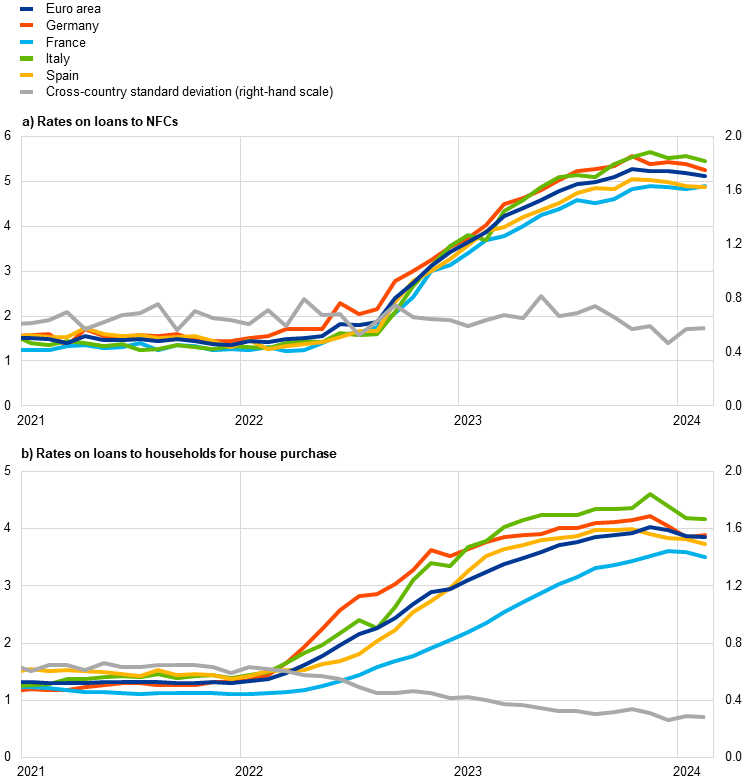
In February 2024 lending rates for firms and for housing loans decreased further. In February lending rates for firms fell to 5.12%, down from 5.18% in January and below the recent peak of 5.27% in October 2023 (Chart 16). This decline was heterogeneous across euro area countries and was more pronounced for large loans with medium-term maturities. The spread between interest rates on small and large loans to euro area firms widened in February to 0.52%, reflecting both lower rates on large loans and higher rates on small loans. Lending rates on new loans to households for house purchase decreased for the third consecutive month to 3.84% in February, down from 3.88% in January and below the recent high of 4.02% seen in November 2023 (Chart 19). This fall was broad-based across maturity segments but was most pronounced for housing loans with medium-term maturities of between one and five years. Variable-rate mortgages remained considerably more costly for borrowers than fixed-rate mortgages. Bank rates on new loans to households for consumption and to sole proprietors also declined in February. The cross-country dispersion of lending rates for firms and households remained at a low level (Chart 16), suggesting smooth monetary policy transmission across euro area countries.
Chart 16
Composite bank lending rates for NFCs and households in selected countries
(annual percentages; standard deviation)
Sources: ECB and ECB calculations.
Notes: Composite bank lending rates are calculated by aggregating short and long-term rates using a 24-month moving average of new business volumes. The cross-country standard deviation is calculated using a fixed sample of 12 euro area countries. The latest observations are for February 2024.
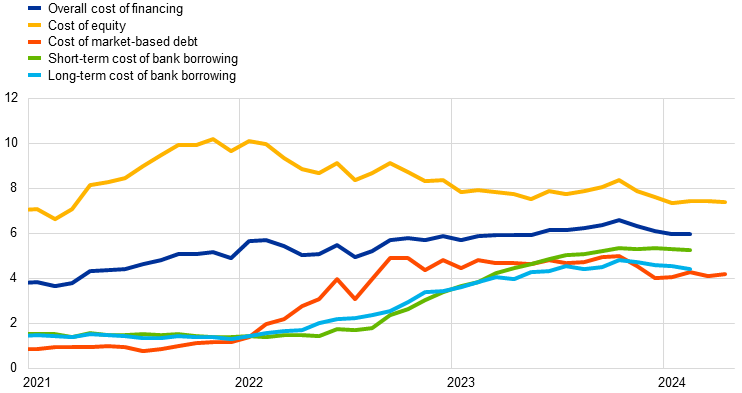
Over the period from 7 March to 10 April 2024, the cost of market-based debt to NFCs did not change, while their cost of equity declined. Based on the available monthly data, the overall cost of financing for NFCs – i.e. the composite cost of bank borrowing, market-based debt and equity – stood at 6.0% in February, broadly unchanged compared with the level in January and considerably lower than the multi-year high reached in October 2023 (Chart 17).[5] This stability was due to the slightly higher cost of equity and market-based debt seen until February largely being offset by the lower cost of both short and long-term loans. The daily data on the cost of market-based debt confirm that there was no change over the period from 7 March to 10 April 2024, although there were differences across bond rating classes. The slight rise in the risk-free rate – as approximated by the ten-year overnight index swap rate – seen over the period and the widening of the spreads on NFC bonds in the high-yield segment was offset by some compression of the spreads on NFC bonds in the investment-grade segment. At the same time, the cost of equity financing declined over the same period, reflecting lower equity risk premiums that outweighed the marginally higher risk-free rate (Section 4).
Chart 17
Nominal cost of external financing for euro area NFCs, broken down by component
(annual percentages)
Sources: ECB, Eurostat, Dealogic, Merrill Lynch, Bloomberg, Thomson Reuters and ECB calculations.
Notes: The overall cost of financing for non-financial corporations (NFCs) is based on monthly data and is calculated as a weighted average of the cost of borrowing from banks (monthly average data), market-based debt and equity (end-of-month data), based on their respective outstanding amounts. The latest observations are for 10 April 2024 for the cost of market-based debt and the cost of equity (daily data), and for February 2024 for the overall cost of financing and the long and short-term cost of bank borrowing (monthly data).
In February 2024 the annual growth rate of bank lending to firms increased modestly but remained low, while for households it remained broadly stable at levels marginally above zero. Annual growth in loans to NFCs saw a slight rise to 0.4% in February, up from 0.2% in January (Chart 18, panel a), amid considerable cross-country heterogeneity. The ongoing weakness in loan growth reflects the stagnant lending dynamics observed since the beginning of 2023 on the back of weak aggregate demand, tight credit standards and restrictive monetary policy. The annual growth rate of loans to households showed signs of stabilising at low levels, remaining unchanged at 0.3% in February (Chart 18, panel b) amid negative housing market prospects, tight credit standards and high lending rates. This stabilisation was seen across segments, although at different levels: housing loans showed slightly positive growth and consumer loans remained resilient, but loans to sole proprietors continued to have negative growth rates. The results of the ECB’s Consumer Expectations Survey in March 2024 were that a large, but declining, net percentage of survey respondents had the impression that credit access had become harder over the previous 12 months and expected it to become even more difficult over the next 12 months.
Chart 18
MFI loans in selected euro area countries
(annual percentage changes; standard deviation)

Sources: ECB and ECB calculations.
Notes: Loans from monetary financial institutions (MFIs) are adjusted for loan sales and securitisation; in the case of non-financial corporations (NFCs), loans are also adjusted for notional cash pooling. The cross-country standard deviation is calculated using a fixed sample of 12 euro area countries. The latest observations are for February 2024.
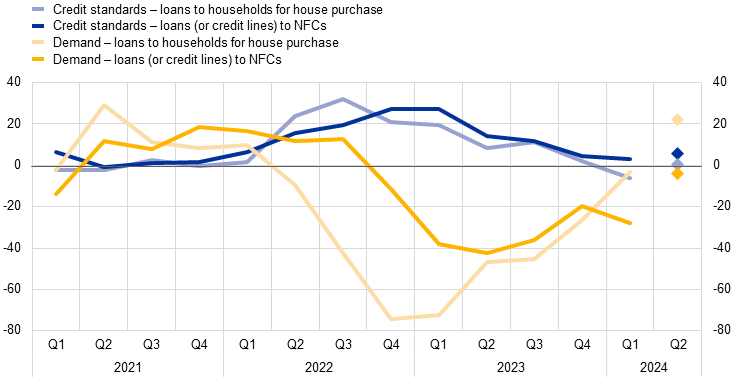
According to the April 2024 euro area bank lending survey, banks reported a further small tightening of their credit standards for loans to firms and a moderate easing of credit standards for loans to households for house purchase in the first quarter of 2024 (Chart 19). The tightening of credit standards for firms was smaller than banks had expected in the previous round, but still added to the substantial cumulative tightening seen since 2022. Banks also reported further tightening for consumer credit which, like lending to firms, was driven primarily by risk perceptions linked to the economic outlook and borrower credit worthiness. By contrast, the easing reported for housing loans arose from competitive pressures and, to a smaller extent, from higher risk tolerance. Euro area banks expect a moderate tightening for loans to firms in the second quarter of 2024 and unchanged credit standards for loans to households.
Banks reported a further substantial decline in demand for loans by firms and a small fall in demand for housing loans in the first quarter of 2024, contrary to bank expectations of a recovery. Banks also reported broadly unchanged demand for consumer credit and other lending to households. As in recent quarters, loan demand by firms was mainly dampened by higher interest rates and lower fixed investment, while demand for housing loans came under pressure from weaker housing market prospects and low consumer confidence. The substantial decline in loan demand by firms contrasted with banks’ prior expectations of stabilisation, and the small decrease in demand for housing loans contrasted with bank expectations of a net increase. Moreover, banks reported a further net increase in the share of rejected applications across all loan segments. Banks expect to see a moderate fall in demand for loans to firms and rising demand for loans to households in the second quarter of 2024.
Chart 19
Changes in credit standards and net demand for loans to NFCs and to households for house purchase
(net percentages of banks reporting a tightening of credit standards or an increase in loan demand)
Source: Euro area bank lending survey.
Notes: For survey questions on credit standards, “net percentages” are defined as the difference between the sum of the percentages of banks responding “tightened considerably” and “tightened somewhat” and the sum of the percentages of banks responding “eased somewhat” and “eased considerably”. For survey questions on demand for loans, “net percentages” are defined as the difference between the sum of the percentages of banks responding “increased considerably” and “increased somewhat” and the sum of the percentages of banks responding “decreased somewhat” and “decreased considerably”. The diamonds denote the expectations reported by banks in the current round. The latest observations are for the first quarter of 2024.
Furthermore, banks expect the reduction in the Eurosystem balance sheet to continue to exert tightening pressure and that the positive impact of past policy rate decisions on bank profits will diminish over the next six months. In the first quarter of 2024, banks’ access to funding improved for debt securities and, to a lesser extent, for money markets, while access to retail funding deteriorated. Banks indicate that the reduction of the ECB’s monetary policy asset portfolio had continued to weigh on their financing conditions and liquidity positions over the past six months, resulting in a moderate tightening of terms and conditions and adversely affecting lending volumes. The impact on credit standards was reported as broadly neutral, although banks expect further tightening pressure over the next six months. In addition, the phase-out of TLTRO III continued to negatively affect banks’ liquidity positions. Reflecting the very significant repayments of TLTRO III funds since November 2022 and the comparatively small remaining outstanding amounts, banks reported only a small tightening impact on their overall funding conditions and a neutral effect on lending conditions. Banks also indicated that ECB key interest rate decisions had again had a marked positive impact on their net interest margins over the past six months, and a dampening effect via their lending volumes that is expected to persist for the next six months. The increase in margins outweighed the volume effect, yielding a high share of banks reporting a positive impact on their net interest income and overall profitability. Banks expect the cumulative net impact of the ECB’s key interest rate decisions on bank profitability to diminish over the next six months, with a moderately negative contribution from higher provisioning needs and impairments.[6]
According to the Survey on the Access to Finance of Enterprises for the first quarter of 2024, firms signalled a modest reduction in the need for bank loans, while fewer firms reported a decline in the availability of bank loans. Accordingly, the increase in the financing gap was smaller than in the previous survey round. Firms perceived the general economic outlook to be the main factor hampering the availability of external financing, while their perceptions of banks’ willingness to lend, which reflects banks’ risk aversion, improved further.
Firms and households continued to reallocate overnight deposits to time deposits in February 2024. The annual growth rate of overnight deposits was less negative and stood at ‑8.9% in February, up from ‑9.9% in January (Chart 20). The continued strong preference for time deposits is explained by the sizeable spread between the rates on time deposits and those on overnight deposits, reflecting the large opportunity costs of holding highly liquid instruments.[7] The rates offered to firms for holding time deposits remained close to the ECB’s deposit facility rate and above those for households. There was another large monthly shift from overnight to time deposits for households, while the pace at which firms rebalanced these two instruments slowed again. This suggests that firms’ deposit allocation is moving closer to the desired level based on historical patterns. High short-term interest rates also supported the substitution of liquid instruments for money market funds.
Chart 20
M3, M1 and overnight deposits
(annual percentage changes, adjusted for seasonal and calendar effects)

Source: ECB.
Note: The latest observations are for February 2024.
The annual growth rate of broad money (M3) increased in February 2024 but remained low, driven by high opportunity costs, stagnant lending and the further reduction in the Eurosystem balance sheet. M3 growth in the euro area increased to 0.4% in February, up from 0.1% in January (Chart 20). Annual growth for narrow money (M1) – which comprises the most liquid assets of M3 – contracted further, but its pace slowed to ‑7.7% in February, compared with ‑8.6% in January. After a sizeable monthly outflow in January, M3 recorded a monthly inflow in February, driven by a decline in central government deposits and by increased lending to other financial institutions amid stagnant lending to the private sector. Money creation was dampened in February by the issuance of long-term bank bonds, the further reduction in the Eurosystem balance sheet and, for the first time since September 2022, a negative contribution from external sector financial transactions amid higher short-term volatility.
Boxes
1 Recent inflation developments and wage pressures in the euro area and the United States
Headline and core inflation levels and momentum dynamics in the euro area are currently somewhat weaker than in the United States. Headline inflation has fallen faster and from a higher peak in the euro area than in the United States in annual percentage terms − from 10.6% in October 2022 to 2.6% in February 2024 in the euro area and from 9.1% in June 2022 to 3.2% in February 2024 in the United States.[8] Momentum (measured as annualised three-month-on-three-month growth) is also weaker in the euro area, for both headline inflation and core inflation (Chart A). In both economic blocs, falling energy prices and moderating food inflation have been significant drivers of the decline in headline inflation, while core inflation remains elevated in both economies.[9]
More2 Why did the import intensity of GDP slow down in 2023?
Euro area imports were subdued in 2023 despite supply bottlenecks easing significantly. During the pandemic, euro area trade declined more than economic activity as supply bottlenecks limited trade in goods and mobility restrictions curbed trade in services, particularly travel and tourism.[10] However, after rebounding in mid-2022, the euro area imports-to-GDP ratio fell in the first quarter of 2023 and has remained at a lower level since then, well below its long-term trend (Chart A, panel a). This can be attributed to the current weakness in imports, which is relatively homogenous across euro area countries, affecting large and smaller countries alike (Chart A, panel b). In this box, we investigate the drivers of the weakened import intensity of euro area GDP in 2023. We show that this weakness was mainly because of the composition of GDP growth following a period characterised by weak exports and consumption, which are among the most import-intensive components of GDP. In addition, we demonstrate that the reduction of inventories also played an important role in the decline in the import intensity of GDP.
More3 How big is the household housing burden? Evidence from the ECB Consumer Expectations Survey
In recent quarters, euro area households have been faced with higher housing costs, including mortgage costs. According to the ECB Consumer Expectations Survey, in the years since the outbreak of the COVID-19 pandemic and amid the surge in energy prices, households in the eleven largest euro area countries have seen rising housing costs, including expenditure on rent or higher mortgage interest payments, home maintenance and utilities (such as gas, electricity and water).[11] Chart A, panel a), shows the dynamics of the overall monthly housing-related burden for outright owners, renters and mortgagors. In January 2024 households were paying an average of €765 per month in total housing-related costs, including utilities, home maintenance and rent or mortgage costs. Over the period from July 2022 – the beginning of the interest rate hiking cycle – to January 2024, the average housing costs reported in the Consumer Expectations Survey rose cumulatively by around 10.2%, compared with a cumulative rise in the Harmonised Index of Consumer Prices (HICP) of 5.5%. Additionally, the dispersion in the monthly housing costs for each of the ownership types has increased. For mortgagors in particular, the higher costs would seem to be driven by the upper end of the distribution, with the cost for the lower end remaining relatively constant. This greater dispersion might suggest heterogeneous effects across mortgagors, i.e. while households with existing fixed-rate mortgages have not, as yet, been affected significantly by the ECB’s monetary policy tightening and the successive interest rate hikes, households taking out new loans or renewing or refinancing existing mortgages are already facing increased interest rate payments.
More4 Housing investment and the user cost of housing in the euro area
Housing investment in the euro area as a whole has fallen significantly from its post-pandemic peak. Housing investment in the euro area fell by about 4% between the first quarter of 2022 and the fourth quarter of 2023, with a particularly sharp decline in Germany and France, a slight rise in Spain and a significant rise in Italy. The fall in housing investment in the euro area was preceded by a sharp increase in construction costs during the pandemic and a significant rise in long-term risk-free rates from the start of the recent monetary policy tightening cycle at the end of 2021 onwards. The rise in interest rates was also accompanied by a tightening of bank credit standards, which in turn contributed to rising mortgage rates and slowing credit flows. These developments, along with the subsequent decline in house prices, prompted an increase in the implied cost of living for homeowners, as measured by the “user cost of housing”. As mortgage rate rises and house price declines appear to be slowing or even reversing to some extent, the question arises of how housing investment will evolve in the period ahead. To shed light on this issue, this box examines the current level of housing investment in the euro area in relation to a novel measure of the user cost of housing.[12]
More5 Main findings from the ECB’s recent contacts with non-financial companies
This box summarises the findings of recent contacts between ECB staff and representatives of 57 leading non-financial companies operating in the euro area. The exchanges took place between 11 and 19 March 2024.[13]
Contacts reported a subdued start to the year for activity, but also a slight uptick in demand (Chart A and Chart B, panel a). In the first months of 2024 activity was affected, to some extent, by industrial unrest and by production delays due to the continuing attacks on shipping in the Red Sea area, but this was more than offset by some recovery in demand for manufactured goods. Perceptions continued to vary significantly, however, both across and within sectors. An increasing number of contacts also stressed differences between growth rates in southern Europe and the more subdued activity in northern Europe, especially Germany.
More6 Decomposing HICPX inflation into energy-sensitive and wage-sensitive items
Understanding the role of different factors behind inflation developments is important for monetary policy. Because of their large share in input costs, especially in the services sector, changes in wage costs are an important factor for developments in HICP inflation excluding energy and food (HICPX inflation). Energy costs account usually for a smaller share of input costs than wages – but in the event of large swings in energy prices they can also have a very substantial impact on HICPX inflation.[14] While energy price movements often have their origin in the external environment, movements in wages are typically more domestically determined. To the extent that energy and wage costs are passed through to consumer prices for goods and services, these also affect HICPX inflation. For instance, the marked increase in HICPX inflation which started in the second half of 2021 and peaked in early 2023 can be linked to indirect effects from the surge in energy prices. The fact that HICPX inflation was relatively persistent for some months after that period, at a time when energy prices were falling, could be linked to high wage growth.
More7 The role of technical factors in euro area inflation‑linked swap rates
This box looks at whether euro area inflation-linked swap (ILS) rates purely reflect inflation compensation – or if these also reflect “technical” factors, which would reduce their information content. When long-term ILS rates for the euro area peaked at 2.7% in summer 2023, their underlying drivers and their information content for monetary policy purposes came under scrutiny. Conceptually, ILS rates comprise the genuine inflation expectations of market participants plus inflation risk premia – referred to together as “inflation compensation” – in the absence of market imperfections. According to asset-pricing theory, risk-averse investors demand inflation risk premia as compensation for being exposed to inflation risk, which is typically positive in periods dominated by aggregate supply shocks.[15] However, owing to market imperfections, ILS rates may not solely reflect inflation compensation as narrowly defined above. For instance, a pension fund that was subject to regulation as regards its exposure to risks might be willing to pay more to hedge inflation risk than one would anticipate on the basis of its inflation expectations and a measure of uncertainty about the inflation outlook. Instrument‑specific liquidity risk premia could also create a wedge between ILS rates and pure inflation compensation. This box uses the catch-all term “technical factors” to cover all additional components arising from market imperfections.
More8 The reformed EU fiscal framework – potential macroeconomic implications for the euro area
This box presents a preliminary assessment of the potential macroeconomic implications for the euro area of the adherence of member countries to the revised rules of the Stability and Growth Pact (SGP) over the period 2025-26.[16] In light of the provisional political agreement reached by the EU co-legislators on 10 February 2024, this box analyses possible implications of the reform for the euro area’s fiscal stance, as well as for the growth and inflation outlook according to the March 2024 ECB staff macroeconomic projections for the euro area.[17] The relevant horizon for the analysis is the period 2025-26, as the revised fiscal rules are expected to take effect from 2025.
MoreArticles
1 Trust in the ECB – insights from the Consumer Expectations Survey
Trust in the ECB among euro area residents is important for the efficacy of the ECB’s monetary policy. The euro itself relies on the trust of its users, as is the case with any fiat currency, and increased trust in the ECB has been shown to better anchor inflation expectations.[18] Trust is thus integral to the effective conduct of monetary policy. However, multiple global crises and increased global uncertainty since the start of the pandemic, coupled with elevated inflation over the last two years, have put central banks in the spotlight. An in-depth understanding of the state of trust in the ECB is thus particularly relevant.
More2 What does new micro price evidence tell us about inflation dynamics and monetary policy transmission?
Inflation depends on whether individual firms decide to change the prices of their goods and services and, if so, by how much. Each month, some prices increase, some decrease and the rest (usually the majority) remain unchanged. These price-setting decisions depend on factors that are specific to the individual firm or to the industry in which it operates, as well as on aggregate shocks and general macroeconomic conditions that affect all firms.
MoreStatistics
https://www.ecb.europa.eu/pub/pdf/ecbu/ecb.eb_annex202403~16c06b5d80.en.pdf© European Central Bank, 2024
Postal address 60640 Frankfurt am Main, Germany
Telephone +49 69 1344 0
Website www.ecb.europa.eu
All rights reserved. Reproduction for educational and non-commercial purposes is permitted provided that the source is acknowledged.
For specific terminology please refer to the ECB glossary (available in English only).
The cut-off date for the statistics included in this issue was 10 April 2024.
PDF ISSN 2363-3417, QB-BP-24-003-EN-N
HTML ISSN 2363-3417, QB-BP-24-003-EN-Q
See “Statement by the ECB Governing Council on advancing the Capital Markets Union”, press release, ECB, 7 March 2024.
According to the updated estimate released by Eurostat on 19 April, euro area real GDP declined by 0.1% in the fourth quarter of 2023. This estimate was not available at the cut-off date for this issue of the Economic Bulletin.
For methodological details, see Górnicka, L. and Koester, G. (eds.), “A forward-looking tracker of negotiated wages in the euro area”, Occasional Paper Series, No 338, ECB, February 2024.
See “ECB recalibrates targeted lending operations to help restore price stability over the medium term”, Press Release, ECB, 27 October 2022.
Owing to lags in data availability for the cost of borrowing from banks, data on the overall cost of financing for NFCs are only available up to February 2024.
The impact reflects both past and expected key ECB interest rate decisions.
As in previous tightening cycles, interest rates on overnight deposits have adjusted to policy rate changes more slowly than those on time deposits. See also the box entitled “Monetary dynamics during the tightening cycle”, Economic Bulletin, Issue 8, ECB, 2023.
See also the box entitled “Inflation developments in the euro area and the United States”, Economic Bulletin, Issue 8, ECB, 2022.
There are some differences between the euro area and the United States in the classification of certain categories in the inflation statistics. In particular, food services are part of services prices in the euro area and part of food prices in the United States. At the same time, alcoholic beverages and tobacco are included in food prices in the euro area and in goods prices in the United States.
See the box entitled “The impact of supply bottlenecks on trade”, Economic Bulletin, Issue 6, ECB, 2021, and the box entitled “Developments in the tourism sector during the COVID-19 pandemic”, Economic Bulletin, Issue 8, ECB, 2020.
For general information on the Consumer Expectations Survey, see “ECB Consumer Expectations Survey: overview and first evaluation”, Occasional Paper Series, No 287, ECB, December 2021.
For a discussion of housing-related costs based on evidence from the ECB’s Consumer Expectations Survey, see the box entitled “How big is the household housing burden? Evidence from the ECB Consumer Expectations Survey” in this issue of the Economic Bulletin.
For further information on the nature and purpose of these contacts, see the article entitled “The ECB’s dialogue with non-financial companies”, Economic Bulletin, Issue 1, ECB, 2021.
See the box entitled “Underlying inflation measures: an analytical guide for the euro area”, Economic Bulletin, Issue 5, ECB, 2023.
See Campbell, J.Y., Sunderam, A. and Viceira, L.M., “Inflation Bets or Deflation Hedges? The Changing Risks of Nominal Bonds”, Critical Finance Review, Vol. 6, No 2, 2017, pp. 263-301.
Following the European Commission’s legislative proposals of April 2023, the ECOFIN Council reached agreement on a reform of the fiscal rules underpinning the EU’s Stability and Growth Pact on 20 December 2023. For more details, see the Council of the EU press release of 21 December and the accompanying draft Council regulations. While keeping the Council compromise largely intact, the February provisional agreement, which is still pending adoption by the European Parliament, envisages excluding national expenditure on the co-financing of EU-funded programmes from the expenditure path in order to create more incentives to invest. This exclusion does not affect the quantitative estimates in this box.
See “ECB staff macroeconomic projections for the euro area, March 2024”, published on the ECB’s website on 7 March 2024.
See, for example, Christelis, D., Georgarakos, D., Jappelli, T. and van Rooij, M., “Trust in the Central Bank and Inflation Expectations”, International Journal of Central Banking, Vol. 16, No 6, 2020, pp. 1-37.