


Published as part of the ECB Economic Bulletin, Issue 3/2024.
Understanding the role of different factors behind inflation developments is important for monetary policy. Because of their large share in input costs, especially in the services sector, changes in wage costs are an important factor for developments in HICP inflation excluding energy and food (HICPX inflation). Energy costs account usually for a smaller share of input costs than wages – but in the event of large swings in energy prices they can also have a very substantial impact on HICPX inflation.[1] While energy price movements often have their origin in the external environment, movements in wages are typically more domestically determined. To the extent that energy and wage costs are passed through to consumer prices for goods and services, these also affect HICPX inflation. For instance, the marked increase in HICPX inflation which started in the second half of 2021 and peaked in early 2023 can be linked to indirect effects from the surge in energy prices. The fact that HICPX inflation was relatively persistent for some months after that period, at a time when energy prices were falling, could be linked to high wage growth.
Data from different sources can be matched to derive indicators that show the importance of energy and wage costs for HICPX inflation. Eurostat’s input-output tables illustrate the structure of the economy in terms of the inputs used and outputs generated in each sector – allowing inter-sectoral linkages to be analysed.[2] This information can be used to derive the direct and indirect shares of energy and wage inputs in all sectors of the economy (according to the NACE 2 classification).[3] The indicator of the importance of energy in the HICPX is computed by estimating energy costs relative to the total output of each sector. This estimate takes into account the direct costs and the indirect costs (via the use of intermediate inputs from other industries) of energy in the production of items in the HICPX.[4] The wage indicator is then obtained using the share of wages in total (labour and non-labour) input costs. Only the direct input costs from wages are taken into account, as the indirect costs via intermediate inputs from other industry and services sectors are likely to occur with some lag because wage-setting is normally staggered. It is also likely that changes in non-labour input costs, such as energy costs, will feed more quickly through the pricing chain as a whole than changes in labour costs, as they are more visible to all parties in the chain. The sectors of the economy according to the NACE 2 classification are then matched with the 211 items in the HICPX basket (based on the ECOICOP 5-digit classification), which allows each item to be classified according to the shares of energy and wages in its costs. This is seen to reflect the sensitivity of the items to the changes in energy and wage costs.[5]
The indicators show that energy accounts for a somewhat larger share of costs for non-energy industrial goods (NEIG) than for services, while wages are especially important in services (Chart A). In the euro area, total energy costs account for a weighted average of around 5.1% of the total output costs for HICPX items. The share is somewhat larger for NEIG (around 6%), reflecting a larger contribution from indirect costs than for services (around 4.5%). Indirect energy costs make up around half of total energy costs in the HICPX and the services component, but have a larger share (around two-thirds) in the NEIG component. This is in line with intermediate non-labour inputs playing a larger role in goods production. For wages, the average direct share in costs for HICPX items is 32%, with a somewhat larger share in services (38%) and a smaller share in NEIG (22%).[6]
Chart A
Implied energy and wage shares in euro area HICPX
a) Implied energy share | b) Implied wage share |
|---|---|
(percentages) | (percentages) |
 |  |
Sources: Eurostat and ECB calculations.
Notes: Direct and indirect cost shares are calculated using the Eurostat symmetric input-output table for 2019. HICPX and services inflation in panel a) exclude rents, which have a wage share of close to zero. Direct costs are the share of energy used for production, whereas the indirect share captures the impact of energy costs via the use of intermediate inputs from all other sectors of the economy. Implied energy shares are calculated relative to total output, whereas implied wage shares are calculated relative to total (labour and non-labour) input costs.
Once HICPX items have been identified as energy-sensitive or wage-sensitive, these can be aggregated to obtain the corresponding inflation rates. To construct wage-sensitive and energy-sensitive indices, thresholds are chosen above which HICPX items are considered wage-sensitive or energy-sensitive. For the indicators described in this box, an item is classified as energy-sensitive if its energy cost share is greater than the average for, respectively, NEIG (6.1%) and services (4.4%). The resulting energy-sensitive sub-basket of the HICPX covers around 36% of the total HICPX basket (based on 2023 HICP weights).[7] For wage-sensitive items, the threshold is set at 38% on the basis of the average share of direct wage costs in total inputs for services items.[8] For the NEIG basket, no item has a share of wages in direct input costs above the threshold – which is why the wage-sensitive HICPX indicator includes only services items.[9] Applying separate thresholds for NEIG and services based on the average shares of wages in input costs in these two categories would have led to several NEIG items (e.g. newspapers, jewellery or cleaning equipment) being classified as wage-sensitive despite having only a relatively small share of wage costs. Their prices would likely be affected to a much smaller degree than services prices by changes in wages. The threshold applied thus allows wage-sensitivity to be effectively captured at the HICPX level.
The resulting indicator for energy-sensitive HICPX illustrates the important role of the past energy shock in HICPX inflation developments over the last few years (Chart B). While differences between energy-sensitive and not energy-sensitive HICPX inflation rates were small until mid-2021, energy-sensitive HICPX inflation subsequently increased more strongly than HICPX inflation, especially in 2022. Following the marked decreases in energy prices more recently, a large part of the gap has now closed.
Chart B
Developments in energy-sensitive HICPX inflation
(annual percentage changes)
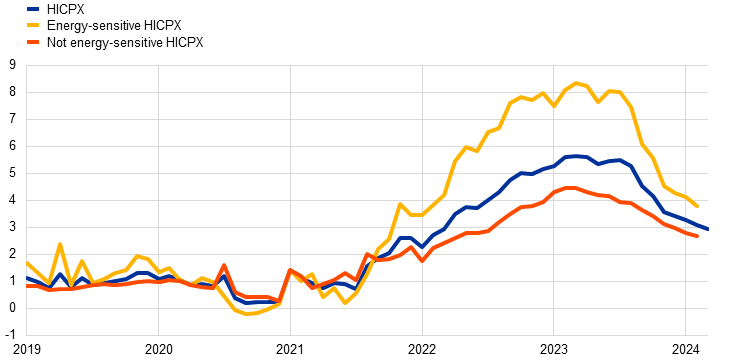
Sources: Eurostat and ECB staff calculations.
Note: The latest observations are for February 2024 for energy-sensitive and not energy-sensitive HICPX, and March 2024 for HICPX (flash estimate).
The indicator for wage-sensitive inflation points to an important role for wages as a driver of HICPX inflation in the euro area more recently (Chart C). Given the inertia in wage-setting in euro area countries and the resulting persistence in wage growth, wage-sensitive HICPX inflation was relatively stable at levels around 2% in 2018 and 2019 – in line with the long-term average growth of unit labour costs in the euro area. The gap between the wage-sensitive and not wage-sensitive HICPX rates over this period may reflect compensation per employee growth above HICPX inflation and thus suggest greater dampening pressures from non-labour input costs than from labour costs as well as downward nominal wage rigidities. With the surge in headline inflation starting in the second half of 2021, wage-sensitive HICPX inflation first increased more gradually than not wage-sensitive HICPX and services inflation, which were more strongly affected by the energy input cost surge and supply shortages. However, since mid-2023 wage-sensitive HICPX inflation (which by construction is equal to wage-sensitive services inflation) has been persistently above HICPX – reflecting the high level of wage growth and indicating that wages and labour costs have become an important factor behind the relative persistence of HICPX inflation in the euro area. Not wage-sensitive services inflation has declined to a greater extent, as for this indicator the considerable easing of energy input cost pressures and upward pressures from supply shortages have played a more important role.
Chart C
Developments in wage-sensitive HICPX inflation
(annual percentage changes)

Sources: Eurostat and ECB staff calculations.
Note: The latest observations are for February 2024 for wage-sensitive and not wage-sensitive HICPX, and March 2024 for HICPX (flash estimate). By construction the indicator for wage-sensitive HICPX is identical to an indicator for wage-sensitive services, because they comprise the same set of items (only services items are included in the wage-sensitive HICPX).
The items underlying the calculation of the proposed indicators of wage-sensitive and energy-sensitive HICPX have little overlap, which helps the interpretation of their signals. Excluding items that are classified as both wage and energy-sensitive has very limited effect on the dynamics of the two indicators (Chart D). This makes it easier to use the indicators to understand the respective roles of wages and energy in the development of HICPX inflation.
Chart D
Role of energy-sensitive and wage-sensitive components in HICPX inflation
(annual percentage changes)
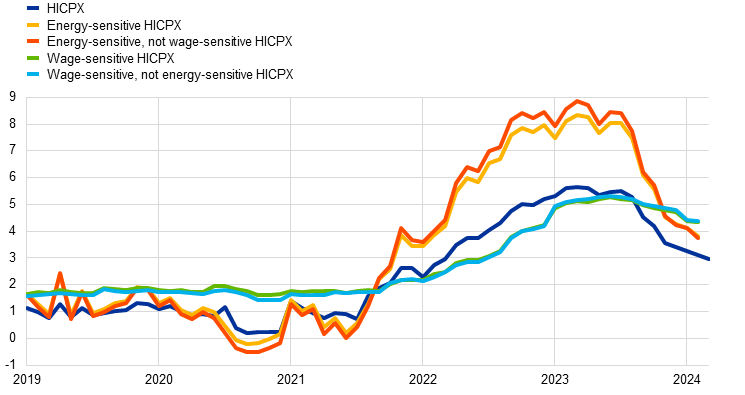
Sources: Eurostat and ECB calculations.
Note: The latest observations are for February 2024 for the four wage/energy-sensitive indicators and March 2024 for HICPX (flash estimate).
See the box entitled “Underlying inflation measures: an analytical guide for the euro area”, Economic Bulletin, Issue 5, ECB, 2023.
For more information see Remond-Tiedrez, I. and Rueda-Cantuche, J.M. (eds.),“EU inter-country supply, use and input-output tables – Full international and global accounts for research in input-output analysis (FIGARO)”, Statistical Working Papers, Eurostat, European Union, 2019.
The energy and wage shares estimated for the purpose of these indicators are based on the Eurostat symmetric input-output table for 2019. The classification may change when more recent input-output tables become available.
These indicators do not capture second-round effects on consumer prices via subsequent possible adjustments in prices and wages.
The use of the ECOICOP 5-digit classification means that the derived indices start as of January 2017 (and annual inflation rates as of January 2018).
The thresholds for wage-sensitivity and energy-sensitivity, as well as the subsequent classification of the consumer price index items, are affected by whether total output or only total inputs (labour and non-labour) are used as the denominator and also depend on whether only direct or also indirect effects (via intermediate inputs) are taken into account. These choices may yield somewhat different implied inflation rates for the energy-sensitive and wage-sensitive HICPX, but the dynamics in these rates and their indications for the role of wage and energy costs in the development of HICPX inflation are very similar and robust across these choices.
Energy-sensitive HICPX items according to the ECOICOP 5-digit classification are the following: 03141, 03142, 04310, 04410, 05122, 05401, 05402, 05403, 05521, 05522, 05611, 05612, 07211, 07224, 07241, 07242, 07243, 07311, 07312, 07321, 07322, 07331, 07332, 07341, 07342, 07350, 07361, 07362, 07369, 08101, 08109, 09331, 09332, 09341, 09342, 09411, 09412, 09423, 09425, 09429, 09541, 09601, 09602, 11111, 11112, 11120, 11201, 11202, 11203, 12111, 12112, 12113, 12132 and 12703 (all other items of the HICPX are classified as not energy-sensitive).
The average share for energy and wage input costs for NEIG and services is obtained as the weighted average across the respective basket after the sectoral level shares have been mapped from the input-output tables to the HICP items.
Wage-sensitive HICPX items according to the ECOICOP 5-digit classification are the following: 03141, 03220, 04321, 04322, 04323, 04324, 04325, 04329, 04420, 04430, 04441, 04442, 05123, 05130, 05204, 05330, 05404, 05523, 05621, 05622, 05623, 05629, 06133, 06211, 06212, 06220, 06231, 06232, 06239, 06300, 07230, 08101, 08109, 09150, 09230, 09323, 09411, 09412, 10101, 10102, 10200, 10300, 10400, 10500, 12111, 12112, 12113, 12122, 12313, 12323, 12401, 12402, 12403, 12404, 12701, 12703 and 12704 (all other items of the HICPX are classified as not wage-sensitive). The wage-sensitive HICPX indicator comprises only services items. It is therefore identical to the wage-sensitive services indicator.