


Published as part of the ECB Economic Bulletin, Issue 1/2024.
This box gauges the macroeconomic impact of climate change policies aimed at reducing greenhouse gas emissions. To meet the goal of reducing emissions in the European Union (EU) by at least 55% in 2030 compared with 1990 levels, governments have started implementing different sets of measures. The EU has recently adopted the “Fit for 55” package, which will be progressively implemented between 2024 and 2034.[1] This box first assesses the impact of green fiscal discretionary measures, as included in the latest December 2023 Eurosystem staff macroeconomic projections on euro area real GDP and inflation. Such measures are unlikely to be sufficient to fully achieve the EU’s targets for emission reduction, energy efficiency and renewable energy production in the Fit for 55 package. The box therefore goes on to illustrate the medium-term impact of alternative transition policy scenarios using model simulations.
The impact of green fiscal measures included in the Eurosystem staff macroeconomic projections
Discretionary fiscal measures that have a positive effect on the green transition are classified as green measures. A fiscal measure, either on the revenue or the expenditure side, is classified as a green measure if it has a positive impact in terms of climate change prevention or adaptation.[2] These measures are principally discretionary decisions by national governments, such as increasing national energy taxes or fuel excises. They do not provide a view on the level of green revenues or expenditures or include the impact of fluctuations in emission permit prices under the EU Emissions Trading System (EU ETS).[3] In line with the principles governing the ECB/Eurosystem staff macroeconomic projections, green measures need to be sufficiently detailed and likely to receive legislative approval for inclusion in the projections.
The combined effect of the green fiscal measures included in the December 2023 Eurosystem staff projections on both headline inflation and GDP growth is small over the projection horizon. The effect on euro area headline inflation is estimated to amount to around 0.1 percentage point in all years of the projection horizon, with minor variation (Chart A). For euro area real GDP growth, the effect is estimated to amount to around 0.07 percentage points in 2023 and to be negative at ‑0.01 percentage points in 2024, ‑0.06 percentage points in 2025 and ‑0.02 percentage points in 2026. The combined effect of the green fiscal measures on both headline inflation and real GDP growth are heterogenous across countries.
Chart A
Impact of green fiscal discretionary measures on real GDP growth and inflation
a) Real GDP growth | b) HICP inflation |
|---|---|
(percentage points) | (percentage points) |
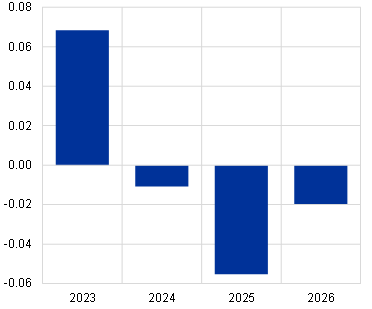 | 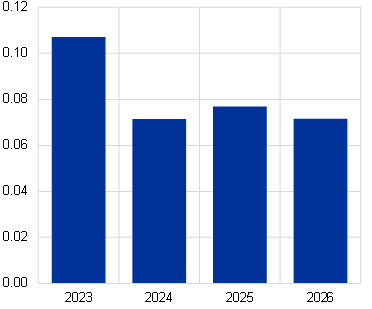 |
Source: December 2023 Eurosystem staff macroeconomic projections.
Notes: A fiscal measure is classified as a green measure if it has a positive impact in terms of climate change prevention or adaptation. This classification relates to discretionary measures which do not include the effect of fluctuations in EU ETS prices.
The fiscal measures included in the Eurosystem staff baseline projections are unlikely to be sufficient to fully achieve the EU targets for emission reduction, energy efficiency and renewable energy production. Some of the measures included in the Fit for 55 package are included in the baseline projections, in particular green fiscal measures that contribute to Member States meeting their national emission reduction targets. However, it is unlikely that the measures (and assumptions) included in the current projections will be sufficient to fully meet EU targets, for several reasons: (i) some of the measures geared to these targets will only be implemented after the end of the current projection horizon in 2026; (ii) some of the EU targets for energy efficiency and renewable energy production still need to be transposed into national and European legislation; and (iii) the national emission reduction targets that were strengthened under the Fit for 55 package, from ‑29% to ‑40% by 2030 compared with 2005, still need to be followed up by EU Member States. That is why recent emission projections by Member States still point to a large gap with the EU targets, and more measures will be needed to achieve the Fit for 55 targets.
Medium-term impact of transition policies consistent with EU emission reduction targets
Model simulations are used to explore the impacts of a number of transition scenarios that are consistent with the EU emission reduction targets. Simulations are performed using the New Area-Wide Model with a disaggregated energy sector (NAWM-E).[4] The benchmark reflects the current emission projections reported by euro area countries and is based on existing policies. To define the benchmark carbon price, the existing carbon tax-related measures are summarised in an effective carbon price as calculated by the Organisation for Economic Co-operation and Development (OECD) corresponding to 87 euro per tonne of CO2 in 2023. The simulations then target an additional emission reduction of 18% by 2030 on top of the reduction required under existing policies, consistent with the EU emission target for a ‑55% reduction by 2030 compared to 1990 levels (Chart B).[5] As many combinations of instruments may achieve this reduction, this box considers carbon taxes and, in one scenario, assumes stronger increases in the productivity of the clean energy sector and a smoother transition away from dirty energy, without explicitly specifying how this can be achieved.
Chart B
EU greenhouse gas emissions
(MtCO2e)

Sources: European Environment Agency (EEA) and ECB calculations.
Notes: Projections are based on data reported by Member States to the EEA, which do not include the Fit for 55 measures.
The model simulations consider the following scenarios (Table A):
- IEA carbon tax scenario: This scenario considers carbon taxes as the only measure for reducing emissions. This assumption is based on the 2022 World Energy Outlook of the International Energy Agency (IEA) and implies a linear increase in the carbon tax to 140 euro per tonne of CO2 by 2030. Alone, this carbon tax path is insufficient to meet EU emission targets (IEA, 2022).[6]
- Fit for 55 carbon tax scenario: This scenario also considers carbon taxes only as the measure for reducing emissions. Carbon taxes increase linearly to 225 euro per tonne of CO2 by 2030. This means the model satisfies the EU emission reduction target in 2030, irrespective of additional carbon regulation or technological progress.
- Fit for 55 policy mix scenario: This scenario considers a mix of rising carbon taxes and non-carbon tax elements. Carbon taxes increase linearly to 180 euro per tonne of CO2 by 2030. Non-carbon tax elements are proxied by a rise in the total factor productivity (TFP) of the clean energy sector by 1% over the simulation horizon, and by considering higher elasticities of substitution between dirty energy and clean energy as well as between energy and other inputs of production and consumption.[7] These non-carbon tax elements capture possible changes in the technology mix in the clean energy sector (for example, stemming from green investment) and tighter environmental regulation. Given that changes in technology are expected to occur over a longer time horizon, this scenario is illustrative and designed to meet the EU’s emission reduction target as well as the EU targets for clean energy production and energy consumption by 2030.
Table A
Overview of scenarios
Scenario | Instruments | Targets achieved by scenarios | |||
|---|---|---|---|---|---|
Carbon tax (EUR/tCO2) | Other | Fit for 55 emissions | Clean energy share | Energy consumption | |
IEA carbon tax | 140 |
| 🗶 | 🗶 | 🗶 |
Fit for 55 carbon tax | 225 |
| ✓ | 🗶 | 🗶 |
Fit for 55 policy mix | 180 | Clean energy total factor productivity: +1% | ✓ | ✓ | ✓ |
Source: ECB.
Notes: The Fit for 55 package is designed to meet EU emission reduction targets and other targets through carbon pricing and regulation. Fit for 55 targets refer to euro area greenhouse gas emissions, and the share of clean energy over dirty energy, as well as energy consumption relative to current EU levels. For emissions, the reductions are compared to euro area countries’ projections based on existing measures (Chart B).
- Carbon taxes lower the demand for dirty energy and induce firms to substitute less costly clean energy for production of the aggregate energy good. The increase in the post-tax price of dirty energy, combined with the rise in the price of clean energy stemming from higher demand for it, causes aggregate energy prices to increase. Higher energy prices feed into the price of households’ consumption bundles and firms’ marginal costs, translating into an increase in headline inflation. On the real side, firms and households experience a fall in their current and expected future profitability and real income respectively, which lowers investment and consumption, and hence GDP. Being a by-product of dirty energy production, carbon emissions decline, while the economy experiences a “green transition” as firms use a higher share of clean energy, but less energy overall for production.
Depending on the scenario, HICP inflation is higher by 0.2 to 0.4 percentage points in 2025 and 2026 than the benchmark with no additional measures, while the level of real GDP is lower (Chart C). The results depend on the scenario: when only carbon tax policy is considered, the effects on GDP and inflation are driven by the magnitude of the carbon tax and the degree of substitution across the energy varieties. Consequently, the Fit for 55 carbon tax scenario amplifies the effects relative to the IEA carbon tax scenario. Under the Fit for 55 policy mix scenario, an increase in the TFP of the clean energy sector improves the efficiency of clean energy, allowing more energy to be produced per unit of clean energy. Higher elasticities of substitution between clean and dirty energy then strengthen the substitution across energy varieties. Together, these elements lead to a reduction in carbon emissions, an increase in the share of clean energy and a reduction in total energy consumption, while maintaining the carbon tax at a lower terminal level. Overall, the negative effects on GDP and inflation are mitigated, especially in the medium term, while GDP increases modestly on impact owing to the expansionary effect of the increase in TFP.
Chart C
Impact of transition policy scenarios on real GDP and inflation
a) Real GDP | b) HICP inflation |
|---|---|
(percentages) | (percentage points) |
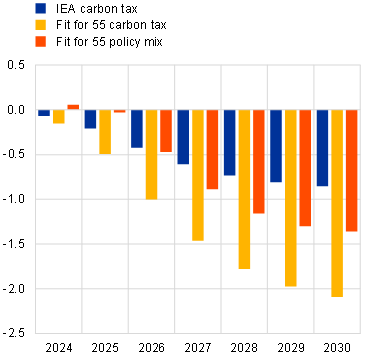 | 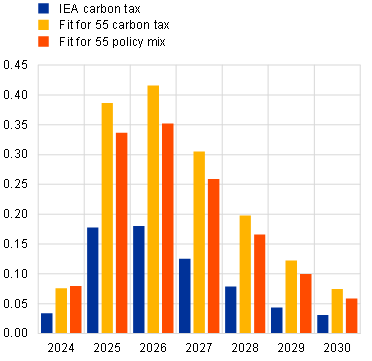 |
Source: ECB.
Notes: Dynamic responses based on NAWM-E simulations relative to a benchmark with existing measures . Simulations start in 2024 and consider endogenous monetary policy.
The NAWM-E simulations suggest that the mix of transition policies is important in determining the extent of lower growth and higher inflation. A caveat of the model-based analysis is that the regulatory elements of the Fit for 55 package are not modelled explicitly, implying that the EU’s emission reduction targets may in practice be attained through alternative combinations of policies with a range of different effects on growth and inflation. Similarly, the analysis does not explicitly model green investment activities, thereby abstracting from time-to-build delays and funding needs. Other modelling choices, such as how carbon revenues are redistributed or how tax policies are implemented (for example, frontloaded, backloaded or staggered) may also affect the results.[8] The scenarios used should therefore be seen as indicative. It should also be acknowledged that it is possible to define different scenarios using different instruments that would achieve the same goals in terms of reducing emissions but have potentially different macroeconomic implications.
See the European Commission’s webpage “Fit for 55: Delivering on the proposals”.
The ECB has gathered information on these measures since the conclusion of its ECB’s strategy review in 2021 as part of the action plan to incorporate climate change considerations into its policy framework. For more information about the classification of climate-related fiscal measures, see Box 5 entitled “Climate-related policies in the Eurosystem/ECB staff macroeconomic projections for the euro area and the macroeconomic impact of green fiscal measures”, Economic Bulletin, ECB, Issue 1, 2023; for the amounts included in the December 2023 Eurosystem staff projections, see Box 8 entitled “Fiscal policy measures in response to the energy and inflation shock and climate change” in this issue of the Economic Bulletin.
While not classified as green fiscal measures, the Eurosystem staff macroeconomic projections are informed by technical assumptions on carbon prices under the EU ETS, which are based on futures prices and foresee a slight increase to €85.2/tCO2 in 2026.
The NAWM-E augments the ECB’s New Area-Wide Model (NAWM) with disaggregated energy production and use, where firms and households demand energy for production and consumption purposes (see Coenen, G., Lozej, M. and Priftis, R., “Macroeconomic effects of carbon transition policies: an assessment based on the ECB’s New Area-Wide Model with a disaggregated energy sector”, Working Paper Series, No 2819, ECB, 2023).
OECD net effective carbon rates, which cover the effective carbon price resulting from national carbon and energy taxes, the EU ETS and offsetting subsidies, are most recently available for 2021. For this exercise, they have been extended to 2023 on the basis of EU ETS future prices and under the assumption that national taxes are unchanged.
The results of this scenario are in line with the analysis presented in Brand, C., Coenen, G., Hutchinson, J. and Saint Guilhem, A., “The macroeconomic implications of the transition to a low-carbon economy”, Economic Bulletin, Issue 5, ECB, 2023, which uses a suite of model approach to assess the impact of carbon taxation on the euro area, as well as with Coenen, G., Lozej, M. and Priftis, R., “Macroeconomic effects of carbon transition policies: an assessment based on the ECB’s New Area-Wide Model with a disaggregated energy sector”, Working Paper Series, No 2819, ECB, 2023.
Exogenous TFP proxies for autonomous energy efficiency improvements, which are frequently used in CGE models and imply that the clean energy use per unit of output declines over time (see, for example, Webster, M., Paltsev, S. and Reilly, J., “Autonomous efficiency improvement or income elasticity of energy demand: Does it matter?”, Energy Economics, Vol. 30(6), 2008, pp. 2785-2798). In this box, the increase in TFP is calibrated to 1%, in line with historical productivity growth rates. Higher elasticities of substitution can be rationalised through a model with directed technical change (see, for example, Hassler, J., Krusell, P. and Olovsson, C., “Directed Technical Change as a Response to Natural Resource Scarcity”, Journal of Political Economy, Vol. 129(11), 2021, pp. 3039-3072). Raising the elasticity between energy and other inputs to 0.8 and that between clean energy and dirty energy to 3 allows energy consumption to decline further and clean energy to increase. The higher value of the between-energy substitution elasticity corresponds to the upper range of empirical estimates in the literature (see Papageorgiou, C., Saam, M. and Schulte, P., “Substitution between Clean and Dirty Energy Inputs: A Macroeconomic Perspective”, The Review of Economics and Statistics, Vol. 99(2), 2017, pp. 281-290).
For more details on the implementation of the carbon tax, see Coenen, G., Lozej, M. and Priftis, R., “Macroeconomic effects of carbon transition policies: an assessment based on the ECB’s New Area-Wide Model with a disaggregated energy sector”, Working Paper Series, No 2810, ECB, 2023.