


The macroeconomic implications of the transition to a low-carbon economy
Published as part of the ECB Economic Bulletin, Issue 5/2023.
1 Introduction
To help avert severe economic damage from climate change, the European Union (EU) has taken measures aimed at reducing greenhouse gas (GHG) emissions to net zero by 2050. The EU’s net-zero goal is set out in the European Green Deal, and comprehensive measures are outlined in the EU’s Fit for 55 package.[2] These aim to reduce GHG emissions by 55% by 2030 (compared to 1990 levels). The Fit for 55 package includes carbon price increases and regulatory measures and foresees massive green investments.
Among the measures aimed at reducing GHG emissions, carbon price increases are generally considered to be an effective instrument. Carbon prices factor the external social costs of carbon emissions into economic transactions. They are directly targeted at the carbon content of production and increase the price of carbon-intensive production relative to less carbon-intensive production. Carbon price increases thus provide an incentive to reduce carbon emissions.[3] In the euro area, the EU emissions trading system (ETS), national carbon taxes and other national environmental taxes, such as excise taxes on fossil fuels, put – directly or indirectly – a price on carbon emissions.
The economic impact of carbon price increases depends on multiple factors. Carbon prices affect economic activity and inflation primarily via higher energy prices. The effectiveness and impact of carbon price increases crucially depend on whether these are implemented in a credible manner and can be factored into the investment and consumption decisions of firms and households. The impact of carbon price increases on the economy also depends on distributional effects, particularly for households, as the regressive nature of higher carbon prices affects low-income households more than higher-income households.[4] Fiscal policies that funnel revenues from higher carbon prices back to lower-income households can mitigate some of these distributional effects and support their acceptance by the public. Alternatively, these revenues can be used to subsidise green investments. As carbon price increases give rise to an output/inflation trade-off, their impact is also influenced by the response of monetary policy. Finally, their effectiveness and impact hinge on transition policies adopted at the global level.
This article provides a model-based assessment of the macroeconomic impact of a higher carbon price path that supports the transition to a low-carbon economy, with a focus on the euro area. To address the high level of uncertainty in gauging the impact of carbon price increases, the assessment is based on a suite of macroeconomic models. In line with the ECB’s climate-change roadmap, this suite includes newly developed models as well as models that have been sourced externally. Section 2 outlines where the euro area presently stands in relation to its commitment to transitioning to net zero; Section 3 presents the propagation channels of higher carbon emission prices to the economy and provides an overview of the models used; Section 4 outlines the carbon price scenario; Section 5 discusses the macroeconomic results; and Section 6 concludes.
2 Where we stand in the transition to net zero in the euro area
Achieving net-zero GHG emissions in line with the EU’s target will require an acceleration of the pace of carbon-emission reductions over the current decade. While a 29% reduction in carbon emissions has been achieved since 1990, as shown in Chart 1, attaining the EU’s intermediate target of a 55% reduction in GHG emissions by 2030 (compared to 1990 levels) will require a sizeable further reduction in carbon emissions. Assuming that non-carbon GHG emissions fall proportionately, attaining these targets will require a further 46% reduction in carbon emissions by 2030 compared to 2021 levels. This is faster than the pace of emission reductions seen since 1990.
Chart 1
CO2 emissions in the EU and the euro area
(MtCO2)
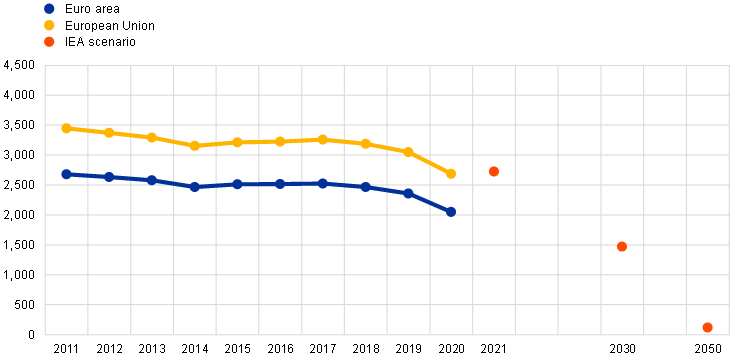
Source: Eurostat and World Energy Outlook (WEO) 2022 of the International Energy Agency (IEA).
Note: The red dots represent announced EU pledges in the IEA WEO 2022.
The targeted reduction of emissions in the euro area is unlikely to be achieved through carbon pricing alone. Indeed, alongside increases in carbon pricing through a more stringent emissions trading system (ETS) with broader applicability across sectors, the Fit for 55 package also includes regulatory measures and support for green investments. Furthermore, the package is complemented by a number of European policy initiatives, such as REPowerEU and the EU’s hydrogen strategy.[5]
According to the Organisation for Economic Co-operation and Development’s (OECD’s) (net) average effective carbon rates (ECRs), the fraction of carbon emissions being taxed is low, and carbon rate levels are widely dispersed across euro area countries. Based on 2021 data, the OECD estimates that carbon taxation in EU countries is too low and too fragmented to achieve the EU’s net-zero targets.[6] The OECD provides a harmonised composite measure of the price of carbon emissions across a wide range of countries by estimating (net) average ECRs. The measure comprises fuel and energy excise taxes, direct carbon taxes and emission trading schemes at the country level for six economic sectors (road transport, off-road transport, industry, agriculture and fishing, residential and commercial real estate, and electricity). ECRs are highly dispersed across euro area countries, as shown in Chart 2, with the level in the Netherlands nearly three times that in Latvia. According to the latest available data (for 2021), the average ECR for the euro area stands at €85/tCO2. The future euro area ECR path captures the direct and indirect carbon price effects resulting from the implementation of the Fit for 55 package and other policy initiatives.
Chart 2
Average effective carbon rates in euro area countries in 2021 (all sectors)
(EUR per tCO2)
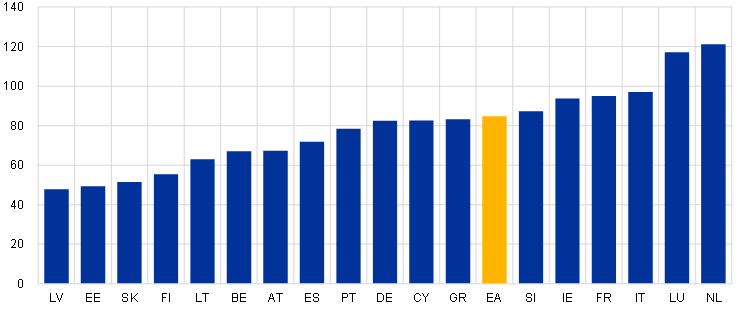
Source: OECD.
Notes: Data for Croatia and Malta are not available. Countries are ordered by ECR net of subsidies for fossil fuels.
3 Propagation channels of higher carbon emission prices
The purpose of a carbon tax is to reduce emissions by factoring the social costs of releasing carbon into private transactions and thereby incentivising more environmentally sustainable production and use of energy. Carbon emissions are a textbook example of a negative externality, as the social costs of carbon emissions are far greater than the private costs incurred by the emitter. Carbon taxes aim to transfer these social costs to the emitters by raising the price of burning fossil fuels in proportion to the amount of emitted carbon. A higher carbon tax thus increases the cost of carbon-intensive production relative to less carbon-intensive production. It incentivises a transition to using less carbon-intensive energy sources and innovation in greener technologies.[7]
In contrast to other mitigation measures, such as subsidies, a carbon tax generates government revenues, at least during the transition phase. A carbon tax generates significant tax revenues for as long as the carbon tax base still remains significant.[8] By contrast, other mitigation measures are either budget-neutral (e.g. regulation) or have the potential to strain public finances (e.g. subsidising green technology).
A higher carbon pricing policy propagates across domestic sectors of the economy (Figure 1). By pushing up energy prices, carbon taxes lower real household incomes and corporate profits and dampen domestic demand. This impact works either directly through consumer prices or indirectly through production costs. Distributional effects may strengthen this impact and point to an important role for fiscal policy. In particular, fiscal policy can mitigate adverse demand effects by funnelling the carbon tax revenues back to lower-income households, thereby sustaining household consumption and supporting public acceptance of the tax. The main shortcoming is that the impact on energy consumption may be mitigated, which would weaken the effectiveness of the tax in reducing emissions. Alternatively, the revenues could be used to finance green transition projects, thereby mitigating output losses from carbon tax increases in a more potent way than other spending measures.[9]
Figure 1
Carbon price propagation channels
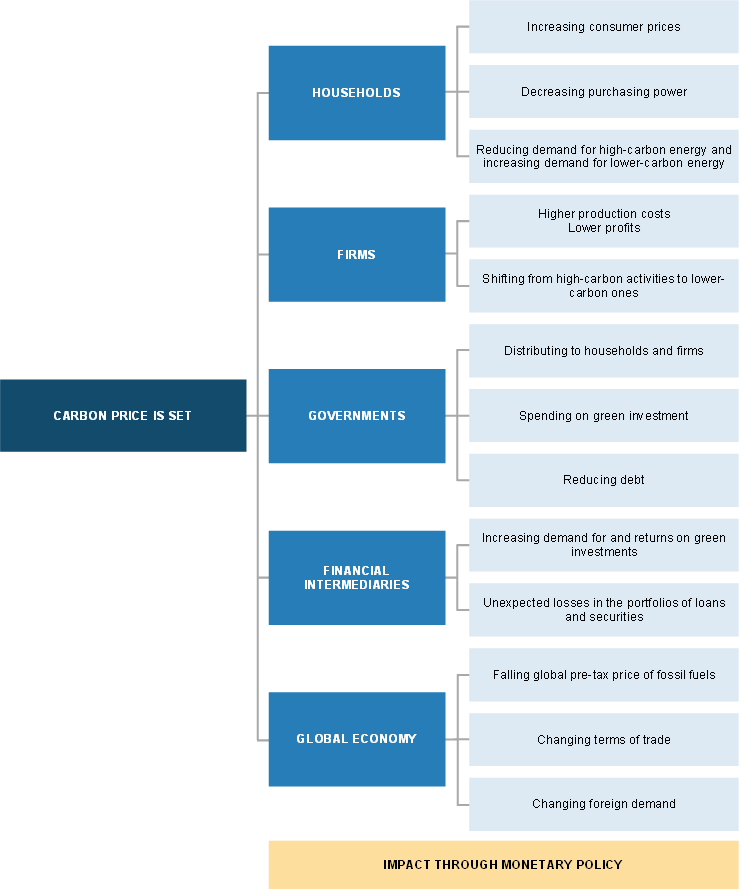
Source: ECB.
A policy of higher carbon prices is primarily aimed at supporting the transition to a lower carbon economy. By ensuring that production cost increases are concentrated in carbon-intensive sectors, a higher carbon price incentivises a shift to using renewable energy and adopting green production technologies. How well this adjustment works will depend on the pace and size of sectoral reallocation, technological adaptation and the ability of financial intermediaries to support the reallocation of capital.
The conduct of monetary policy also plays a role in how a higher carbon price policy propagates to the economy. Given that there are various channels at play that affect demand and supply, it is unclear from the outset which of the channels of adjustment to carbon taxes will dominate. The response of monetary policy will depend on whether adverse supply-side or demand-side effects dominate. Carbon price increases drive an energy price-induced wedge between headline inflation and core inflation. If a central bank can “look through” this headline inflation hump, it will be able to mitigate the negative impact of energy price increases on demand.
In addition, the impact of a higher carbon price policy in the euro area will also depend on the path of the energy transition at the global level. Relative carbon price adjustments at the global level affect the terms of trade for energy goods importers and exporters, foreign demand and competitiveness.[10] Importantly, the more carbon prices are raised in the rest of the world (RoW), the more effective these will be in reducing global emissions.
To sum up, carbon taxes affect the economy in a multifaceted way and modelling their impact is subject to considerable uncertainty. Box 1 outlines the suite of models used for the impact assessment to address this uncertainty.
Box 1
Main features of the suite of models
To deal with the uncertainty associated with the multifaceted way in which carbon taxes affect the economy, the impact assessment is based on a suite of six macroeconomic models currently available to the ECB. The models used in the analysis all feature a set of environmental elements and fall into two classes: (i) three newly developed internal dynamic stochastic general equilibrium (DSGE) models and (ii) three large-scale commercial models (Table A). The DSGE models are two-country models of the euro area and the rest of the world (RoW) or closed-economy models of the euro area. The commercial models are multi-country models that can be used to examine the global dimension of carbon transition policies. These models are part of ongoing efforts by ECB staff to include climate change considerations in the ECB’s macroeconomic modelling portfolio in line with the climate roadmap of the ECB’s monetary policy strategy review and the ECB-wide agenda on climate change.
Table A
Main features of the suite of models
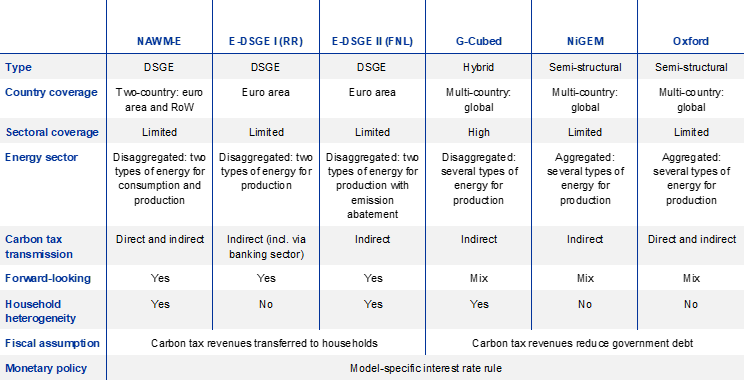
Source: ECB.
Notes: NAWM-E: see Coenen, G., Lozej, M. and Priftis, R., “Macroeconomic effects of carbon transition policies: an assessment based on the ECB’s New Area-Wide Model with a disaggregated energy sector”, Working Paper Series, No 2819, ECB, May 2023; E-DSGE I: see Priftis, R. and Schoenle, R., “Energy shocks through the banking sector and the fiscal-monetary policy mix”, ECB, forthcoming; E-DSGE II: see Ferrari, A. and Nispi Landi, V., “Toward a green economy: the role of central bank’s asset purchases”, International Journal of Central Banking, Vol. 19(4), forthcoming; G-Cubed: see McKibbin, W.J. and Wilcoxen, P.J., “The theoretical and empirical structure of the G-Cubed model”, Economic Modelling, Vol. 16(1), January 1998, pp. 123-148; NiGEM: see Hantzsche, A., Lopresto, M. and Young, G., ”Using NiGEM in uncertain times: Introduction and overview of NiGEM”, National Institute Economic Review, Vol. 244, May 2018, pp. 1-14; Oxford Economics: see “Global Economic Model” on the Oxford Economics website.
The models in the suite feature the necessary environmental and macroeconomic elements to allow for the transmission of carbon taxes through the energy sector, while differing in terms of sectoral granularity. The DSGE models distinguish between “dirty” and “clean” energy inputs for consumption or production purposes, or both, while the commercial models differentiate between energy inputs like electricity, gas, oil, coal and renewables for energy production. To the extent that the energy sector is disaggregated rather than aggregated, the models allow for the substitution of carbon-intensive energy inputs induced by shifts in their relative prices following increases in carbon taxes. Because of this reallocation, carbon emissions – which are a by-product of production in the dirty energy sector – decline accordingly.
The macroeconomic effects of carbon tax increases across models depend on the nature and relative importance of specific transmission channels, including on how well households or firms factor future carbon price increases into their current spending or price-setting decisions. On the nominal side, carbon taxes affect inflation primarily through energy prices – directly via expenditures on energy consumption and indirectly through the production costs of firms. On the real side, carbon tax-induced increases in energy prices dampen domestic demand by lowering real household incomes and corporate profits. The more these effects are anticipated via forward-looking expectations, the more these will lead to a frontloaded fall in consumption and investment. Similarly, these may lead to a frontloaded increase in prices set by firms in anticipation of higher energy costs. The impact of carbon taxes, especially on investment, also depends on the presence of financial amplification effects. Cost-driven declines in corporate profits may result in a fall in asset prices, which would restrict the access of firms to bank financing.
Another distinguishing feature is the presence of household heterogeneity, as carbon taxes are regressive and have distributional effects. Increases in carbon taxes affect low-income households more than higher-income households, strengthening the adverse impact on aggregate demand. This distributional channel points to an important role for fiscal policy. In particular, redistributing carbon tax revenues to lower-income households through targeted transfers can mitigate the adverse demand impact. Since comparing the alternative design of fiscal policy in reducing adverse demand effects is beyond the scope of this exercise, scenario assumptions have been calibrated to ensure that fiscal policy remains sufficiently passive without giving rise to secondary demand effects (e.g. carbon tax revenues are assumed to be paid back to households as a lump sum or used to reduce public debt, depending on the model).
The models employed also feature an explicit role for monetary policy, which influences the overall near to medium-term macroeconomic impact of carbon taxes. All models use Taylor-type policy rules, whereby the interest rate responds to a measure of inflation and activity, albeit to different degrees across models. The precise policy impact depends on the specification of the rule used in each model and the relative strengths of the various transmission channels of the carbon tax.
4 The carbon tax scenario
The initial carbon prices in the scenario are anchored in the OECD’s ECR estimates for 2021 and the IEA’s net-zero scenario. In the scenario, the average ECR in the euro area is assumed to increase linearly from €85/tCO2 in 2021 to €140/tCO2 in 2030, in line with the interim carbon price target for advanced economies with net-zero pledges, as considered in the net-zero scenario in the IEA’s WEO 2022. For the RoW, the scenario assumes a proportionate increase from lower levels (Chart 3). Whether these ECR paths are ambitious enough is uncertain, with carbon price target estimates differing widely across institutions. As carbon prices enter the models as a tax, the scenario is referred to interchangeably as a carbon price scenario or a carbon tax scenario.
Chart 3
Carbon price path in the scenario
(EUR per tCO2)
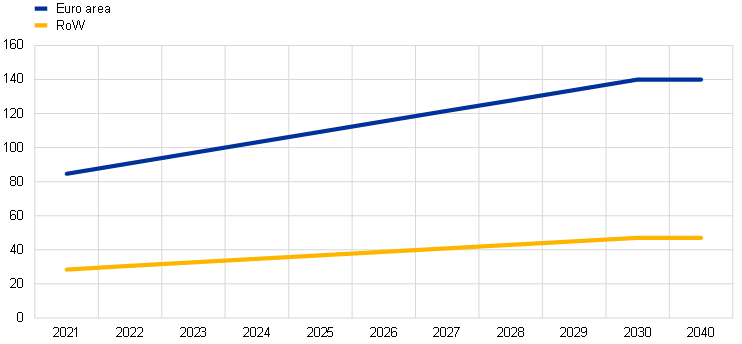
Source: OECD and ECB staff calculations.
The impact of the carbon tax scenario is compared to a baseline which assumes that there is no change in the carbon tax and that no climate events occur that adversely affect the economy over the simulation horizon. This approach reflects the fact that, while economic damage from climate change on account of the existing concentration of GHG in the atmosphere is materialising, it is challenging to quantify the timing and magnitude of this damage. It also implies that the carbon tax scenario does not materially lower the likelihood and incidence of climate-related physical risks over the coming years. Clearly, the assumption of no climate damage as a result of not raising carbon taxes is unrealistic in the long run.
The scenario has a narrower scope than either the International Monetary Fund (IMF) or the Network for Greening the Financial System (NGFS) climate scenarios. The scenario assumes that fiscal policy is neutral to the extent possible and that monetary policy responds according to a model-specific rule (see Box 1). By contrast, the IMF analysis looks at alternative fiscal policy assumptions, while the simpler set-up in this article reflects a conscious choice to keep the analysis tractable in view of the rather complex and diverse model portfolio used.[11] The NGFS climate scenarios consider a range of alternative physical risk and transition pathways up to 2100 in combination with different climate policies that are calibrated to meet certain end-of-century temperature targets.[12]
5 The effects of the carbon tax scenario
The overall impact of the carbon tax scenario on real GDP is rather contained (Chart 4, panel a). There is a relatively gradual build-up of the GDP effect over the scenario horizon, with a permanent effect on the level of GDP by 2030. Specifically, GDP falls to between 0.5% and 1.2% below the baseline in 2030, translating into an average annual GDP growth roughly 0.1 percentage point lower over the scenario horizon. In general, the results are quite dispersed across models, being driven by differing impacts on private consumption and, in particular, on investment. Dynamic stochastic general equilibrium (DSGE) models which incorporate financial frictions exhibit the most pronounced decline in GDP.
Chart 4
Impact of carbon tax policy on GDP and selected components
(percentage deviations from baseline)

Sources: NAWM-E, E-DSGE I + II, G-Cubed, NiGEM and Oxford Economics.
Note: The chart displays the impacts (range and median) of the carbon tax scenario on euro area real GDP, private consumption and business investment between 2022 and 2030.
Private consumption is dampened across all models as higher energy prices reduce household income (Chart 4, panel b). Due to income losses, households cut back consumption. They frontload these spending cuts to the extent that they factor future income losses from energy price increases into their current spending decisions. This is the case in models featuring forward-looking households. By contrast, in models in which households are more backward-looking, the decline in consumption is primarily due to a fall in current disposable income, so the impact builds up only gradually over time. Another factor driving differences in consumption responses across different models is fiscal policy. Alternative model-specific designs of the fiscal-policy response to the carbon tax increase generate differences in the impact on income and private consumption. For example, in some models, budget neutrality is implemented via lump-sum transfers of tax revenues to households, which in turn act as a buffer to limit the negative impact on income and consumption.[13]
Investment declines, albeit to different degrees across models, as higher energy prices squeeze corporate profits (Chart 4, panel c). Falling profits for firms weigh on investment. This impact is reinforced as declining profits depress the value of the physical assets of firms (i.e. the shadow price of capital, especially in the fossil fuel sectors) and tighten financing conditions. This channel is more pronounced in the DSGE models than in the large-scale commercial models where investment responses are based on the user cost of capital. The aggregate investment path can mask significant sectoral re-allocation of capital, characterised by robust investment growth in the renewable energy sector being overcompensated by very large capital losses in the fossil fuel sectors.
While the impact on inflation is also modest and gradually diminishes towards the end of the scenario horizon, there are some differences in near-term inflation dynamics (Chart 5, panels a and b). In some models, the impact is more frontloaded, with firms setting their prices in a more forward-looking manner, also factoring in energy price increases in the future. In other models with more backward-looking price-setting behaviour of firms, the inflation impact is more gradual. Core inflation (measured in terms of inflation excluding the direct energy price impact) is barely affected at all. Overall, the impact on inflation tends towards zero by the end of the scenario horizon in all models, but the price level will have permanently shifted to a higher level by 2030.
The monetary policy trade-off created by the carbon tax scenario appears limited (Chart 5, panel c). Measured in terms of the response in short-term nominal interest rates, monetary policy reacts modestly across models. Interest rates evolve within a narrow range, increasing in models that emphasise supply-side effects (primarily on inflation) and declining in those that emphasise demand-side effects. Overall, in balancing the demand and supply-side effects, the monetary policy stance is somewhat loosened, as is evident from the fact that the interest rate in real terms declines across all models.
Chart 5
Impact of carbon tax policy on inflation measures and monetary policy response
(percentage point deviations from baseline)
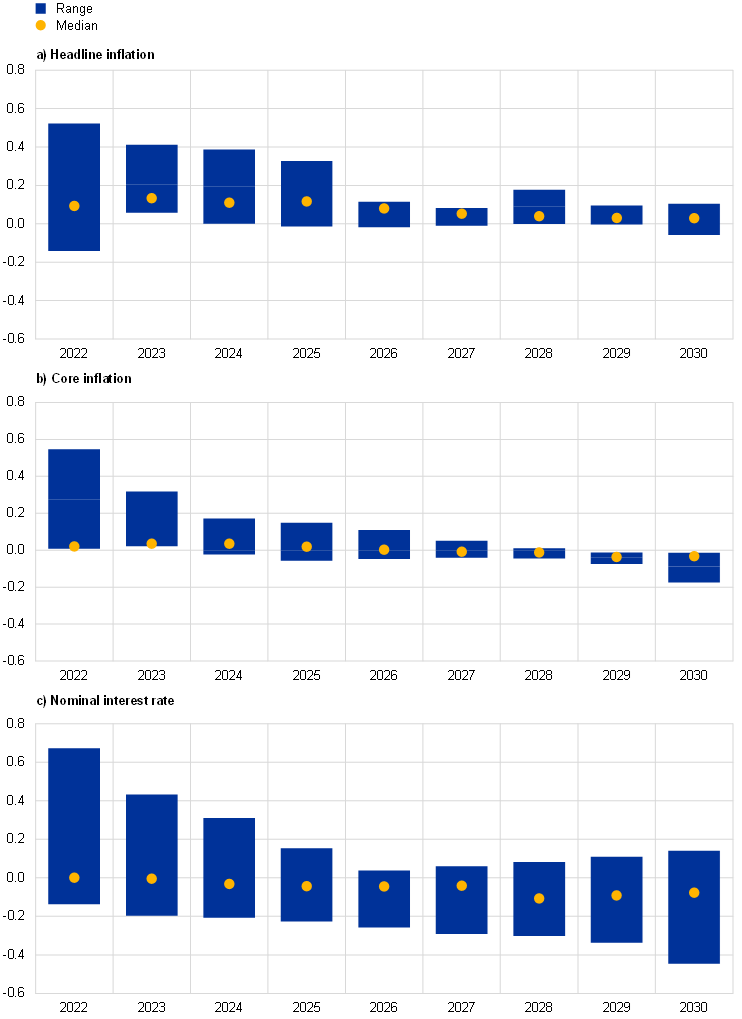
Sources: NAWM-E, E-DSGE I + II, G-Cubed, NiGEM and Oxford Economics.
Notes: The chart displays the impacts (range and median) of the carbon tax scenario on euro area headline inflation, core inflation and the short-term nominal interest rate between 2022 and 2030. Core inflation measures are only displayed for NAWM-E, G-Cubed and Oxford Economics.
The small size of the impact of the carbon tax increase on inflation also highlights its different economic nature when compared to an energy supply shock. The small size of the inflation impact can be compared with that of an energy supply shock to highlight its specific nature. The assumed carbon price increase is implemented in a gradual but persistent and predictable manner, thereby allowing the economy time to adjust. Moreover, it affects goods prices and production costs in proportion to their carbon content. By contrast, an energy supply shock is typically not anticipated, much larger and more temporary. It affects energy prices indiscriminately or not in proportion to their carbon content. These aspects are evidenced in the evolution of gas prices since the invasion of Ukraine by Russia (Chart 6). At the onset of the invasion and in the subsequent months, gas prices increased sharply, but they have declined markedly in recent months. Over the same period, oil prices have also fluctuated significantly, but their fluctuations have been much more limited than the extreme fluctuations in gas prices given fears of possible disruptions of gas supply in the euro area during 2022.
Chart 6
Commodity price developments
(index: 23 February 2022 = 100)

Sources: Refinitiv, HWWI and ECB calculations.
Notes: Gas refers to the Dutch TTF gas price. The data are indexed to the values prevailing on the day prior to the start of the Russian invasion of Ukraine on 24 February 2023. The latest observations are for 22 May 2023 for oil and gas and 19 May 2023 for commodities excluding energy.
Model simulations suggest that adjustments to carbon prices alone might be insufficient to reach the EU’s ambitious emission targets (Chart 7). The dispersion of estimated carbon emission reductions achieved with the carbon price increase is very large across models. Models with low elasticities of substitution between carbon-intensive and renewable energy technologies, high capital adjustment costs and less responsive renewable energy supply typically show lower carbon emission reductions for a given impact on output. Overall, the median of the widely dispersed estimates points to a reduction of carbon emissions of about 11% by 2030. This is only a limited contribution to reaching the EU’s interim target of a 46% reduction in emissions between 2021 and 2030. The shortfall and its dispersion across models reflect model-specific propagation channels, particularly in relation to the elasticity of substitution between high-carbon and low-carbon fuels. In addition, the IEA’s net-zero scenario is more comprehensive and entails a broad set of policy measures beyond carbon prices. The global dimension of implementing a carbon tax and its implications are further discussed in Box 2.
Chart 7
Impact on carbon emissions
(percentage deviations from baseline)
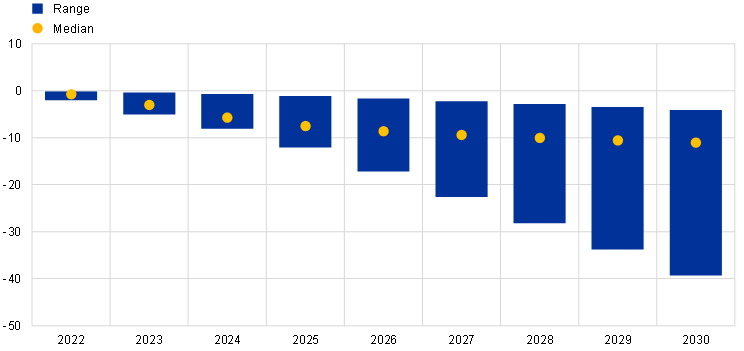
Sources: NAWM-E, E-DSGE I + II, G-Cubed, NiGEM and Oxford Economics.
Note: The chart displays the impact (range and median) of the carbon tax scenario on euro area carbon emissions between 2022 and 2030.
A combination of increased green energy supply and technological efficiency gains, complementing a sufficiently high carbon price, will support the closing of the emissions reduction gap. For instance, simulations using NAWM-E indicate that a 10% increase in the supply of renewable resources or in the efficiency of green energy production would reduce carbon emissions by an additional 2 percentage points (see Coenen et al., op. cit.). In these cases, there is a greater reduction in carbon emissions even though the fall in GDP is smaller. Similarly, policies that foster a higher elasticity of substitution between carbon-intensive energy and green energy would also help reduce emissions. Based on NAWM-E, a higher elasticity than assumed in the model would also lead to an additional reduction in emissions by about 3.5 percentage points, provided that the supply of green energy adjusts.
The carbon tax scenario generates additional revenues that could be used to finance green investments. The gradual increase in the carbon tax generates average annual revenues ranging between 0.3% and 1.1% of GDP in 2030. While no exact breakdown of overall investments is available, according to European Commission estimates, about €1,000 billion (6% of GDP) of private and public investments will be required per year over the period 2021-2030 to reach the Fit for 55 target, suggesting that it is unlikely that the public share in these investments can be funded solely by carbon tax revenues as generated under the scenario.[14]
The findings from the carbon tax scenario are broadly consistent with those of the IMF (Chart 8). Benchmarking the carbon tax scenario against a comparable analysis undertaken by the IMF in the October 2022 World Economic Outlook indicates that, for a similar-sized carbon tax increase, the impact on GDP, inflation and carbon emissions is within the same range.[15] In order to make a meaningful comparison between the two analyses, the euro area carbon tax increase in the IMF analysis is normalised to the carbon tax increase used in the scenario in this article. The carbon tax increases by $135/tCO2 in the IMF’s main scenario, which compares to €55/tCO2 in the benchmark scenario in this article.
Chart 8
Comparing the model-based findings with IMF estimates
(panel a: percentage deviations from baseline in 2030; panel b: percentage point deviations from baseline, annual average over 2022-2030; panel c: percentage deviations from baseline in 2030)
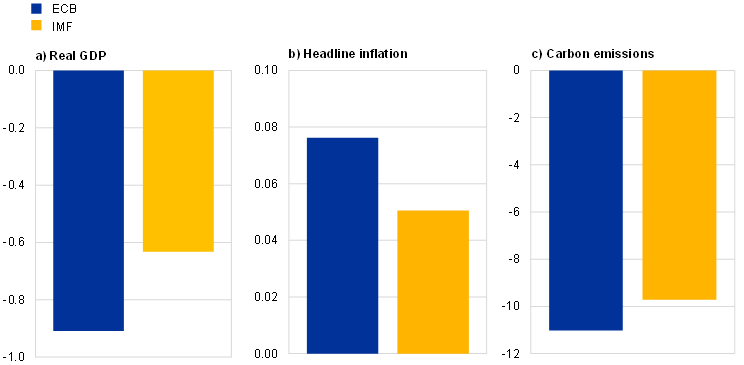
Sources: NAWM-E, E-DSGE I + II, G-Cubed, NiGEM, Oxford Economics and the IMF’s GMMET model.
Notes: Panel a) displays the impact of the carbon tax scenario on real GDP in 2030; panel b) shows the average scenario impact on headline inflation between 2022 and 2030; and panel c) displays the scenario impact on CO2 emissions in 2030. For the ECB models, median effects are reported. The IMF’s estimated effects have been rescaled to reflect an equally sized increase in carbon taxes.
Box 2
The global dimension of a carbon tax: some sensitivity analysis
As the euro area contributed about 5% to global CO2 emissions in 2021 (Chart A), any potential carbon tax policy implemented in the rest of the world (RoW) would have potentially significant macroeconomic consequences, including for the euro area, and implications for global carbon emission reductions, competitiveness and terms of trade. This box presents some sensitivity analysis of the impact of alternative carbon tax assumptions for the RoW on the euro area economy and on global CO2 emissions using the Oxford Economics and NiGEM global models. It transpires that the more uniform and ambitious the scope of the global carbon tax is, the larger the reduction in global demand for fossil fuels and CO2 emissions and the greater the adverse impact on the euro area economy would be. Overall, the results underscore the importance of synchronised international cooperation on climate policy.
Chart A
World carbon emissions
(percentages)

Source: “Global Energy Review: CO2 Emissions in 2021”, IEA, 2022.
Note: The chart displays contributions by region to world annual CO2 emissions based on IEA analysis.
Two scenarios are considered, which differ from the benchmark scenario as regards the RoW carbon tax assumption: (i) “high RoW”, where the RoW reaches the same carbon tax price as the euro area by 2030; and (ii) “no RoW”, where no carbon tax is implemented in the RoW. Scenarios (i) and (ii) can be viewed as upper and lower bounds to the benchmark scenario as presented in the main body of the text.[16]
While euro area GDP steadily declines in all three scenarios, the decline is most pronounced in the high RoW carbon tax scenario (Chart B). In this scenario, the higher carbon tax implemented in the RoW dampens euro area foreign demand, which in turn has a negative effect on euro area GDP. In the no RoW scenario, the impact on euro area GDP is smaller than in the benchmark scenario on account of the weaker drag from euro area foreign demand.
Chart B
Impact on euro area real GDP
(percentage deviations from baseline, annual averages)
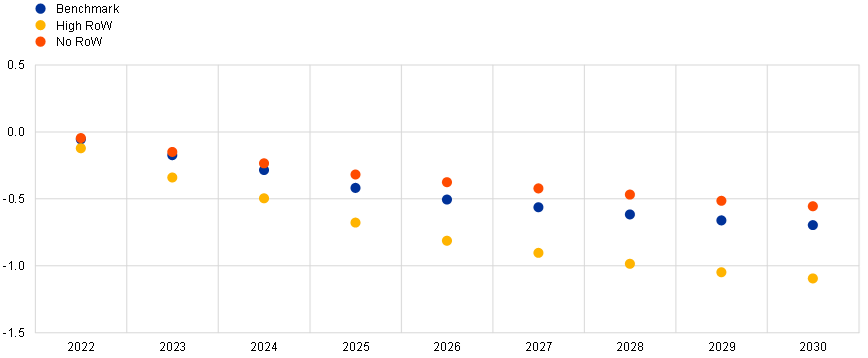
Sources: NiGEM, Oxford Economics and ECB staff calculations.
Notes: The chart displays the average impact on euro area real GDP in the Oxford Economics and NiGEM models for three different carbon tax scenarios with different assumptions about the carbon tax increase in the RoW between 2022 and 2030.
In line with the global transmission channels outlined in Section 3, the carbon tax increase leads to an improvement in the terms of trade (the amount of goods a country can purchase for a certain amount of exported goods) for energy-importing countries and a deterioration for commodity exporters (Chart C, panel a). Commodity exporters experience a worsening of their terms of trade because both world demand for and (pre-tax) prices of fossil fuels decline by the end of the scenario horizon owing to carbon price increases. This effect is different to that of an energy supply shock where the increase in the price of fossil fuels benefits the terms of trade of commodity exporters. For the euro area, in the long run the terms of trade improve overall, particularly in the high RoW scenario, as the relative increase in export prices eventually exceeds that of import prices.
Chart C
Impact on terms of trade and fossil fuel energy intensity
a) Terms of trade
(percentage deviations from baseline)
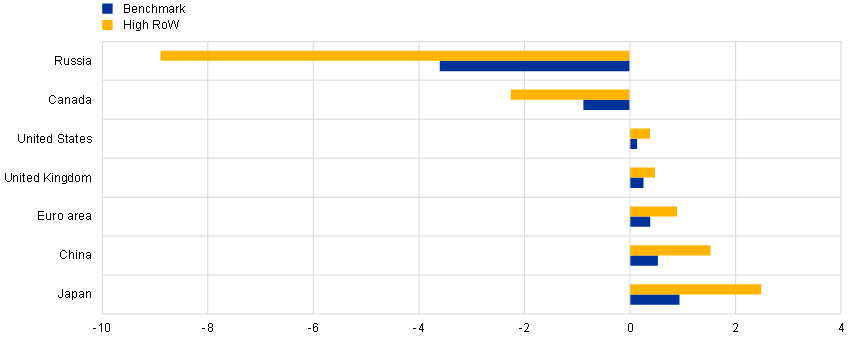
b) Fossil fuel energy intensity: historical and model-based results
(MJ per USD GDP in 2017 US dollar terms at purchasing power parity; percentage deviations from baseline)
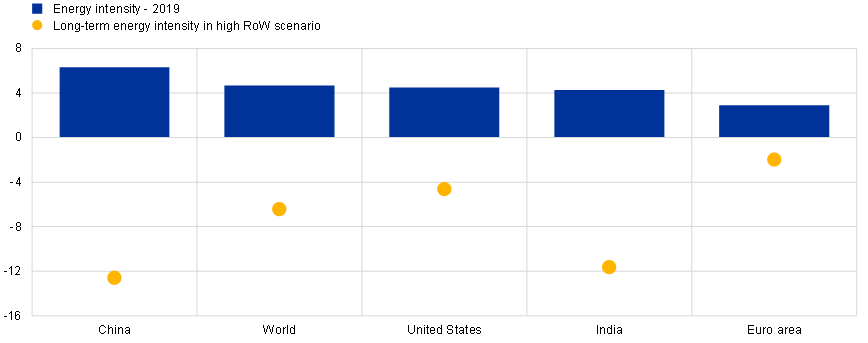
Sources: NiGEM and Oxford Economics global models and ECB staff calculations.
Notes: Panel a) displays changes in the long-term terms of trade for the benchmark and high RoW carbon tax scenarios. Panel b) shows the changes in energy intensity in the high RoW carbon tax scenario. The results are based on the average of the Oxford Economics and NiGEM models.
The exercise also illustrates that, for a given carbon price increase, the reduction in carbon emissions and the implied macroeconomic effects vary across countries depending on how much they rely on fossil fuels. In particular, countries that are more reliant on fossil fuels, such as China, would experience the largest reduction in fossil fuel energy intensity by implementing a carbon tax policy (Chart C, panel b). On the other hand, countries that are less reliant on fossil fuels experience a smaller reduction. This illustrates that the marginal gains from carbon pricing in terms of reducing fossil fuel intensity should come primarily from carbon-intensive economies. Moreover, these gains can be expected to decline over time as the policy is implemented.
The more uniform and ambitious the global carbon tax policy is, the larger the reductions in CO2 emissions would be, albeit still falling short of global climate commitments (Chart D). Overall, global CO2 emissions in 2030 are reduced by about 15% in the high RoW carbon tax scenario, which is about three times more than in the benchmark scenario. These developments stand in stark contrast to the no RoW carbon tax scenario, in which the euro area implements a carbon tax policy unilaterally. In that case there is only an insignificant reduction in global CO2 emissions.
Chart D
Global CO2 emissions
(percentage deviations from baseline)
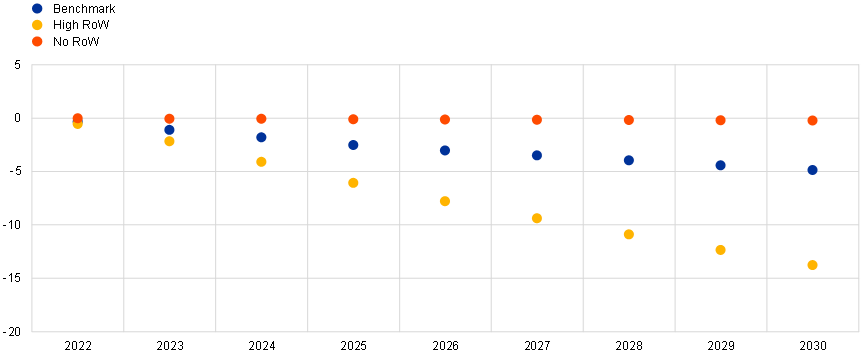
Sources: NiGEM and Oxford Economics models.
Note: The chart displays the average impacts on world carbon emissions across the Oxford Economics and NiGEM models for three different carbon tax scenarios with different assumptions about the carbon tax increase in the RoW between 2022 and 2030.
Overall, these illustrative scenarios highlight the importance of international cooperation on climate policy, the need for a sufficiently high carbon price and the importance of using a broad portfolio of carbon policy instruments tailored to the structure of individual countries.
A central bank with a preference for “looking through” the direct carbon tax-induced inflation effects to mitigate output losses would have to tolerate higher headline inflation for a protracted period (Chart 9). To examine the output/inflation trade-off that the central bank is faced with, additional sensitivity analysis was carried out using NAWM-E. The illustrative analysis assumes that the central bank follows a simple Taylor-type rule and either opts to lean against the direct inflationary effects of the carbon tax-induced increase in energy prices by focusing on the stabilisation of headline inflation or, conversely, chooses to look through these direct effects and focus on core inflation, i.e. inflation excluding energy.[17] According to the model, the carbon tax increase lowers output and pushes up inflation in both cases, but to different degrees. If the central bank wants to mitigate the output losses from leaning against the direct inflationary impact of the induced energy price increase, it may look through the energy price impact and focus on stabilising core inflation. Adopting such a look-through approach would result in a stronger easing of the monetary policy stance, as can be seen from the stronger fall in the real interest rate, and thereby limit output losses, but at the cost of higher headline inflation. At the same time, as a look-through approach generates a significantly more protracted deviation of headline inflation from its target than the approach of stabilising headline inflation, it may entail a loss of credibility for monetary policy and increase the risk of a de-anchoring of inflation expectations. In such circumstances, monetary policy would have to correct its look-through approach and act forcefully as it faces higher costs in terms of stabilising output and inflation. However, a very forceful reaction could also push core inflation persistently below the inflation target.
Chart 9
Monetary policy and the output/inflation trade-off: sensitivity analysis
(percentage point deviations from baseline)
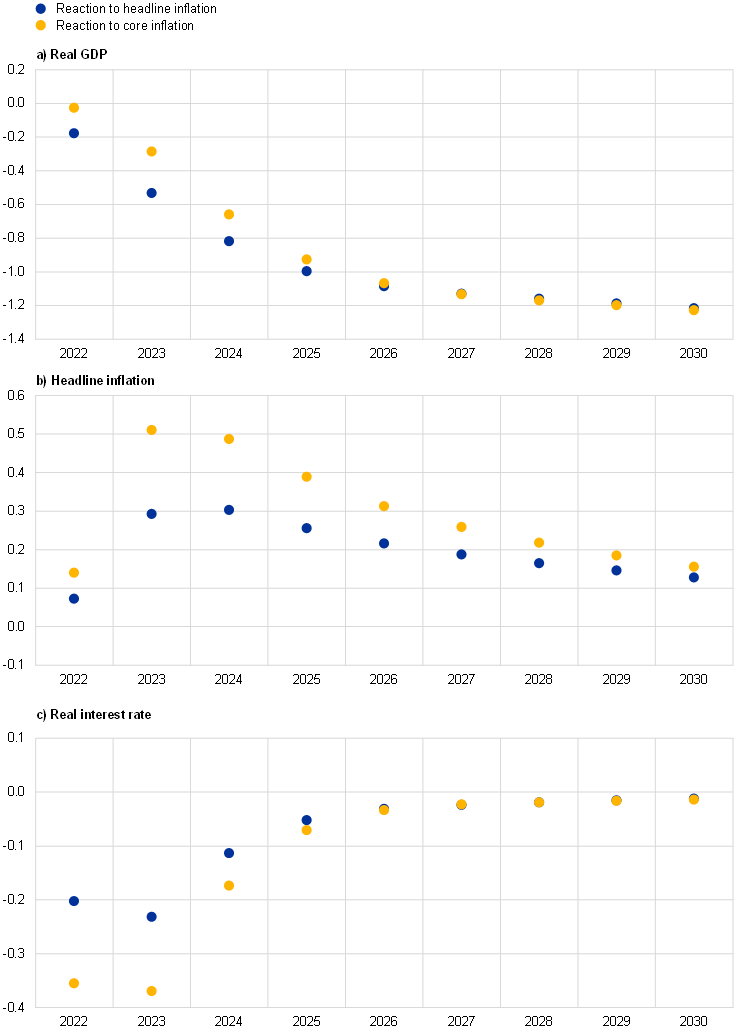
Source: NAWM-E.
Notes: The chart displays the impacts of the carbon tax scenario on euro area real GDP, headline inflation and the short-term real interest rate between 2022 and 2030. In the underlying simulations, monetary policy follows a Taylor-type interest-rate rule with a reaction to either headline inflation or core inflation, along with a reaction to the output gap. In contrast, the model’s default interest-rate rule features reactions to core inflation and the output growth gap.
6 Conclusions
Model-based estimates of the impact of a plausible carbon tax path for the rest of this decade suggest limited effects on output and inflation, but also only a limited contribution to reaching the EU’s carbon emission reduction goals. Carbon price increases affect output and inflation primarily via energy price increases, but the impacts also depend on distributional effects, global transition policies, fiscal and monetary policy, and the ability of financial intermediaries to support the reallocation of capital. Carbon price increases consistent with the IEA’s net-zero scenario in 2050 suggest a moderate impact on euro area GDP and inflation over the current decade, with a modest output/inflation trade-off for monetary policy as it seeks to preserve price stability in the medium-term. At the same time the estimated carbon emission reductions are limited, being equal to around one-quarter of the EU’s intermediate goal. Achieving greater cuts in emissions through higher carbon prices would have a bigger impact on inflation and GDP, with a more sizeable trade-off for monetary policy. In any event, reaching the EU’s climate goals will require a mixture of ambitious carbon emission pricing, additional regulatory action and technological innovation, as set out in the Fit for 55 package.
Prepared in liaison with Alina Bobasu, Kai Christoffel, Alistair Dieppe, Michael Dobrew, Marien Ferdinandusse, Alessandro Ferrari, Thaïs Massei, Romanos Priftis, Angela Torres Noblejas and Aurelian Vlad.
For more information on the European Green Deal and the EU’s Fit for 55 package, see “A European Green Deal – Striving to be the first climate-neutral continent” and “Fit for 55” on the European Commission and European Council websites respectively.
For a comprehensive review of the literature on carbon pricing, see Timilsina, G.R., “Carbon taxes”, Journal of Economic Literature, Vol. 60(4), December 2022, pp. 1456-1502. For a discussion of complementarities between different carbon transition policy instruments, see Blanchard, O.J., Gollier, C. and Tirole, J., “The portfolio of economic policies needed to fight climate change”, Working Papers, No 22-18, Peterson Institute for International Economics, November 2022.
For a discussion of distributional effects of carbon pricing on consumption across different income groups, see the article entitled “Fiscal policies to mitigate climate change in the euro area”, Economic Bulletin, Issue 6, ECB, 2022.
See “A European Green Deal – Striving to be the first climate-neutral continent” on the European Commission’s website and the references therein.
See Avgousti, A. et al., “The climate change challenge and fiscal instruments and policies in the EU”, Occasional Paper Series, No 315, ECB, April 2023.
See Aghion, P., Dechezleprêtre, A., Hémous, D., Martin, R. and Van Reenen, J., “Carbon taxes, path dependency, and directed technical change: Evidence from the auto industry”, Journal of Political Economy, Vol. 124(1), February 2016, pp. 1-51.
See the article entitled “Fiscal policies to mitigate climate change in the euro area”, op. cit.
See Batini, N., Di Serio, M., Fragetta, M., Melina, G. and Waldron, A., “Building Back Better: How Big Are Green Spending Multipliers?”, IMF Working Papers, No 2021/087, International Monetary Fund, March 2021, which suggests that the fiscal multiplier of green investment is slightly larger than one.
On the effects of differing carbon pricing policies on the export of carbon-intensive production, i.e. carbon leakage, see Böning, J., Di Nino, V. and Folger, T., “Stop carbon leakage at the border”, The ECB Blog, ECB, 1 June 2023.
See “Near-Term Macroeconomic Impact of Decarbonization Policies”, World Economic Outlook, IMF, October 2022, Chapter 3.
Further information can be accessed via the NGFS Scenarios Portal.
Sensitivity analysis based on NAWM-E shows that the regressive effects of a carbon tax increase on low-income households can be addressed by means of targeted transfers of the tax revenues. See Coenen et al., op. cit.
See “The EU economy after COVID-19: implications for economic governance”, European Commission, October 2021.
The IMF analysis considers alternative policy packages regarding the use of the fiscal revenues accruing from the carbon tax increase. See “Near-Term Macroeconomic Impact of Decarbonization Policies”, World Economic Outlook, IMF, October 2022, Chapter 3. The benchmarking is carried out for the case where the tax revenues are transferred to households, which is fiscally the most neutral case and consistent with the approach followed for the DSGE model-based analysis presented in this article.
Both scenarios are conducted under the assumption of fixed exchange rates.
For a normative analysis of the reaction of monetary policy to a carbon tax shock within a stylised New Keynesian model, see Olovsson, C. and Vestin, D., “Greenflation?”, Working Paper Series, No 420, Sveriges Riksbank, May 2023. The analysis suggests that it is optimal for monetary policy to look through the increase in energy prices due to the carbon tax and focus on core inflation.