


The impact of recent shocks and ongoing structural changes on euro area productivity growth
Published as part of the ECB Economic Bulletin, Issue 2/2024.
1 Introduction
The COVID-19 pandemic and the energy crisis have interacted with the ongoing transition to a greener and more digital economy, with uncertain impacts on productivity growth. During the acute phase of the pandemic, productivity per employee fell as a result of labour hoarding and reduced capacity utilisation. The rapid policy responses to the pandemic-induced crisis at the national and European levels prevented a wave of bankruptcies, but also possibly inhibited productivity-enhancing reallocation of resources. The pandemic changed the ways in which firms invest and produce and people consume and work, triggering an acceleration of the ongoing digitalisation of the euro area economy, also supported by the Next Generation EU (NGEU) funds. These changes can have substantial and positive impacts on productivity, but further investments in complementary skills and intangibles are needed to reap their full benefits. In addition, the energy price shock that followed the Russian invasion of Ukraine and the transition to a greener economy are changing relative prices of inputs and affecting the production and investment decisions of firms, with a bearing on their productivity. The impact is expected to be negative over the short term but, given the need for production processes to adapt, green innovation might lift productivity prospects over the longer term.
This article summarises the key results of recent work on productivity by a group of experts from the European System of Central Banks (ESCB).[1] The analysis builds on previous work undertaken in the context of the ECB monetary policy strategy review.[2]
The article is organised into four sections. After this introduction, Section 2 studies the impact of the pandemic and support policies on productivity and resource reallocation across and within sectors of activity. Section 3 analyses the potential productivity impact of the digital and green transitions: the section first explores whether and through which channels digital technologies could be a game changer for productivity growth in the euro area, and then examines the impact of the change in relative input prices brought about by the green transition and recent energy shock on innovation and productivity-enhancing resource reallocation. Section 4 concludes this article.
2 The impact of the COVID-19 pandemic
The pandemic differed from previous crises in at least three ways: (1) the broad impact of the crisis across countries, sectors and firms; (2) the measures taken to contain the spread of the virus, such as lockdowns and changes in the way people work and consume; and (3) the scope and magnitude of the policy support granted.[3]
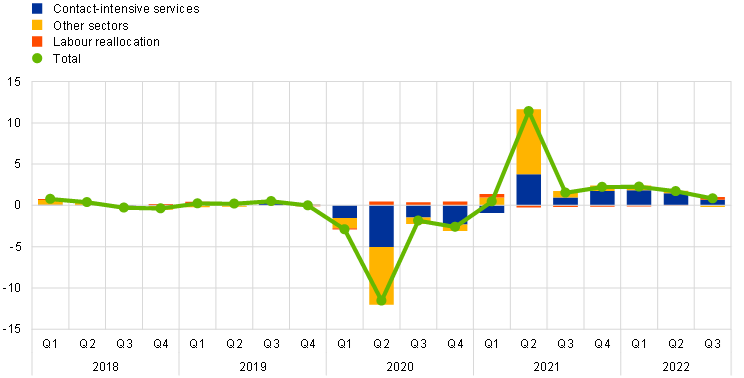
Job retention schemes (JRS) were one important part of the policy response and could be a reason for differing productivity developments during the pandemic, depending on whether productivity is measured per employee or per hour worked. Job retention schemes set incentives to keep workers employed by their firms, even if they worked fewer hours. This enabled firms to adjust to the shock by reducing working time rather than laying people off. As a result, productivity in 2020 increased if measured as GDP per hour worked and declined if measured as GDP per employee (Chart 1). The analysis in this article, based on firm-level data, will focus on labour productivity measured as output per employee, given the lack of information on hours worked at the firm level.
Chart 1
Productivity developments in the euro area
a) Labour productivity per employee
(annual percentage changes)
b) Labour productivity per hour worked
(annual percentage changes)
Source: Authors’ calculations based on Eurostat data.
Note: The aggregate labour productivity growth is decomposed into growth originating from within economic sectors (within-sector component) and from change in the employment shares of the sectors (between-sector labour reallocation component). Furthermore, the within-sector component can be decomposed into the contribution of sectors less and more exposed to the COVID-19 shock. The latter are the contact-intensive services and include the following sectors under the NACE classification: wholesale and retail trade, repair of motor vehicles and motorcycles (code G in the NACE classification), transportation and storage (H), accommodation and food service activities (I), arts, entertainment and recreation (R) and other activities (S-U).
Short-term impact and reallocation of resources
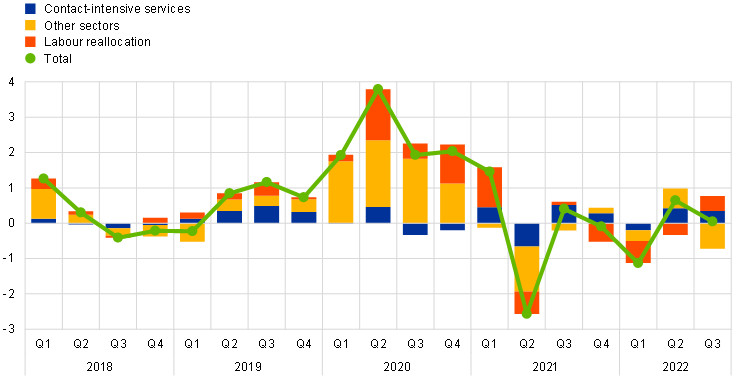
The decline in productivity per employee in 2020 was driven by the strong decline in within-firm productivity growth. Chart 2 decomposes sectoral labour productivity growth in selected euro area countries between 2019 and 2020 into the contributions of the within-firm component and the reallocation of labour across firms in the sector (between-firm component).[4] In most countries there was a strong decline in within-firm productivity growth. This reflects the effect of the reduced capital utilisation, the JRS and the consequent larger drop in output relative to the number of employees.
The pandemic and the related policies possibly inhibited but did not prevent the productivity-enhancing reallocation of resources across and within sectors. Crises can have a “cleansing effect”, which is understood to be the disproportionate impact of adverse economic shocks on low productivity firms. The resulting reallocation of resources from low to high productivity firms can mitigate the negative productivity developments during busts caused by low capacity utilisation and labour hoarding. However, this reallocation process could have been altered during the pandemic because both low and high productivity firms operating in the most contact-intensive sectors were similarly affected. Also, the wide reach and vast magnitude of supporting measures to protect the corporate sector, both at the national and European levels, could have prevented the contraction and exit of low productivity firms and thereby inhibited the cleansing effect. Chart 2 shows that the contribution of the reallocation of resources across existing firms (between-firm component) was positive for productivity growth for the group of countries considered, and mitigated the aggregate decline in labour productivity in 2020.[5] This means that low productivity firms contracted relatively more than their high productivity counterparts. In addition, Chart 3 below shows that relatively low productivity firms exited the market in 2020. Both pieces of evidence point to the pandemic having a cleansing effect. However, as will be shown, the cleansing effect was less pronounced than in other crises.
Chart 2
Contributions to sector labour productivity growth in 2020
(annual percentage changes)
Source: Authors’ calculations based on individual firm data from the included countries.
Notes: Productivity measured as real value added per employee, with the exception of Greece, where it is calculated as revenue per employee. This is a shift-share analysis of sector productivity growth, distinguishing between the contribution of the change of productivity of each firm, given initial market shares (within-firm margin), and the change of market shares of firms with different productivity levels (between-firm margin).
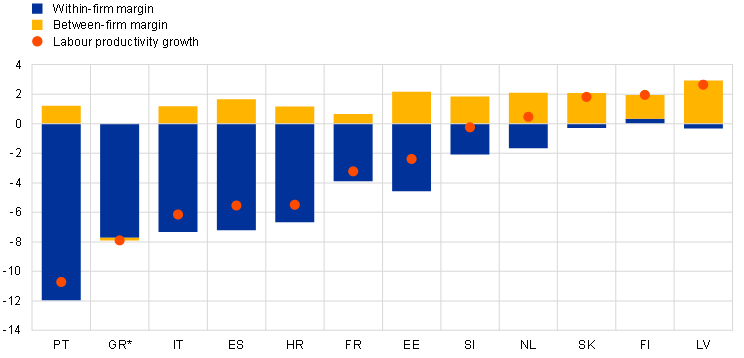
Less productive firms exited the market during the first year of the pandemic, contributing to the cleansing effect. Resources can also be reallocated across firms because of firm entry into, and exit from, the market. When less productive firms are substituted by new, more productive firms, firm dynamism is productivity-enhancing. As shown in Chart 3, the productivity distribution of firms that exited the market in 2020 was skewed to the left when compared with the productivity distribution of survivors in their sector. That is, firms exiting the market had on average lower productivity than incumbent firms, contributing to the productivity-enhancing reallocation of resources.
Chart 3
Distribution of productivity of firms that exited compared with survivors in the same sector in 2020
(density)

Source: Authors’ calculations based on Orbis-iBACH firm-level data.
Notes: The data refer to Belgium, Germany, Spain, France, Italy and Portugal. Labour productivity is defined as real value added per employee.
However, when the economy contracted sharply in 2020, fewer firms exited than in other crisis episodes, which mitigated the cleansing effect. To test if firm exits were different in 2020 to previous crises, the estimated historical reaction of firm exits to the decline in economic activity is compared with the dynamics observed during the acute phase of the pandemic in the five largest euro area economies. The results presented in Table 1 show that the pandemic reaction was much smaller than in previous crises: the correlation between firm exit and economic activity (-0.031) decreased to about -0.01 during the pandemic (as suggested by the sum of estimated coefficients: ‑0.031+0.024). This was the result of several factors, including bankruptcy freezes that resulted either from lockdowns that stalled administrative procedures or from policy decisions taken to avoid a wave of bankruptcies in some countries.[6] The policy support to the corporate sector also contributed to fewer firms exiting, as shown below.
Table 1
Firm exits in relation to changes in economic activity
Dependent variable: firm exit rate
Regressor | Estimated coefficient |
|---|---|
Sector activity | -0.031 *** |
COVID-19 dummy (2020=1) | -0.490 * |
Sector activity x COVID-19 dummy | 0.024 ** |
Observations | 3,209 |
R-squared | 0.57 |
Source: Authors’ calculations based on sector-level Eurostat data.
Notes: The table presents the results of an OLS regression with sector, country and year fixed effects, using data from Germany, Spain, France, Italy and the Netherlands over the period 2004-2020 and across 50 two-digit sectors. The dependent variable is the country-sector-year firm exit ratio and the main regressor is the country-sector-year value added growth, as a proxy for the cyclical position of the sector. The interaction with the COVID-19 dummy (2020=1) shows fewer firm exits as a reaction to a 1 percentage point drop in value added growth during the COVID-19 period. Errors are clustered at the sector level. *** significant at 1% level, ** significant at 5%, * significant at 10%.
The role of policy support
The rapid policy support provided to corporates and households prevented a wave of bankruptcies and preserved households’ incomes. The support was thus a key factor behind the rapid economic recovery of the euro area economy following the pandemic-induced crisis. However, it is important to examine whether the unprecedented policy support during the pandemic had undesired impacts on aggregate productivity growth.
Firm-based evidence from several euro area countries suggests that policy support did not significantly distort resource reallocation across existing firms in 2020. In order to analyse the allocation of policy support across firms during the pandemic, it is necessary to merge data on a firm’s characteristics with information on the support received by that firm in the form of subsidies, loan moratoria and guarantees. This merged dataset, available for six euro area countries, shows that firms in the middle of the productivity distribution had the highest probability of being supported in 2020 (Chart 4, dark blue line).[7] In addition, the size of support increased with firm productivity.[8] Therefore, at the onset of the crisis, policy support was not specifically allocated to low productivity firms and consequently did not contribute to the misallocation of resources.
However, the relative probability of low productivity firms receiving support increased significantly during the second year of the pandemic crisis. Highly productive firms exited the support schemes early in the pandemic. Therefore, during the second year of the pandemic, the probability of firms with low productivity receiving support increased compared with more productive firms in all countries that have available data (Chart 4, yellow line). Hence the allocation of subsidies became more distortionary over time, despite unchanged eligibility criteria.[9]
Chart 4
Probability of receiving wage subsidies by productivity of the firm, 2020 and 2021
(percentage point difference in the probability of receiving support relative to the reference category (first decile))

Source: Authors’ calculations based on firm-level data from Croatia, Latvia and Slovakia.
Notes: Changes in the probability of receiving subsidies for a firm in a given productivity decile with respect to the lowest productivity decile (first decile). The whiskers represent confidence intervals. An average of the results for Croatia, Latvia and Slovakia is presented.
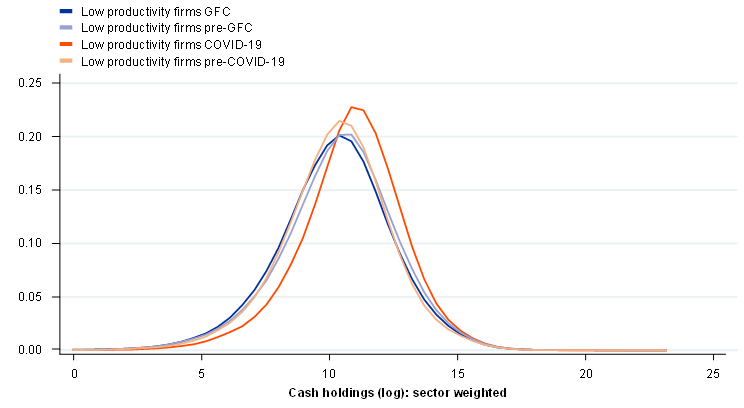
Complementary analysis shows that, compared with other crises, the muted exit rate of firms in 2020 could to some extent be attributed to low productivity firms having large cash buffers (Chart 5). Low productivity firms, defined as those in the bottom half of the productivity distribution in each sector, enjoyed relatively healthy cash buffers in 2020. This could explain their greater capacity to stay in the market during the pandemic compared with other crises such as the global financial crisis (GFC). There could be different reasons for the healthier cash buffers. Firms may have had healthier balance sheets prior to the pandemic, or they may have benefited from fiscal support during the pandemic. To disentangle these factors, Chart 5 shows the cash holding distribution in 2020 (in red) and in 2009, the peak year of the GFC (in blue), and during the year preceding both crises (in light red and light blue). It is apparent that the cash buffers of low productivity firms in 2020 were higher than in 2009, and that the increase occurred in 2020, not in 2019. This suggests that support policies may have played a key role in the muted exit rate of firms in 2020.
Chart 5
Cash holding distribution of low productivity firms during the global financial crisis and the pandemic
(density)
Source: Authors’ calculations based on Orbis-iBACH data from Belgium, Germany, Spain, France, Italy and Portugal.
Notes: Low productivity firms are defined as those in the bottom half of the productivity distribution in each country-sector. Sectors are then aggregated using value added weights. GFC is 2009, pre-GFC is 2008, COVID-19 is 2020 and pre-COVID-19 refers to 2019. Productivity is measured as real value added per employee.
Monetary policy also played a role in mitigating the adverse effects of the crisis brought on by the COVID-19 pandemic. At the time of writing, it was not yet possible to quantify the impact of monetary policy on firm-level productivity growth as firm-level data were not yet available for the period following 2020/2021. However, an analysis of historical data can give some indication of the possible effects of monetary policy during the pandemic. In general, monetary policy has an impact on productivity by positively affecting the business cycle, but also by reducing financial frictions of relatively high productivity firms.[10]
Long-term productivity impacts of the pandemic
It is still too early to gauge the long-term consequences of the pandemic on productivity growth. Identifying the impacts is also difficult because other shocks with potentially large effects on productivity growth have hit the economy since the pandemic. This section highlights the main structural changes with a possible impact on productivity growth over the long term and leaves the precise quantification of their impact for future analysis, as data become available.
The pandemic and related lockdowns accelerated e-commerce and online shopping. Early on in the pandemic, deflated retail trade turnover dropped by approximately 20% (Chart 6, panel a). Online shopping, in contrast, increased sharply and was still approximately 30-40% above pre-COVID-19 levels in 2022. The impact of such a surge in online sales on productivity growth is not clear-cut and the effect differs across firm characteristics and other determinants. The literature has found that the spread of online platforms has had a positive impact on incumbent firms’ productivity growth.[11] These productivity gains are the result of increases in value added rather than reductions in employment, indicating that online platforms generate larger business opportunities.
In similar fashion, teleworking increased sharply in the spring of 2020 with the introduction of social distancing measures. The percentage of employees working frequently or occasionally from home increased sharply in 2020 and rose further to almost 25% in 2021 (Chart 6, panel b). The surge in teleworking may affect productivity growth through various channels. First, teleworking may lead to greater efficiency, thanks to the time saved on commuting, which partly translates into longer working hours.[12] Second, it may result in a reduction in the stock of capital, especially real estate, needed by firms to operate.[13] Third, teleworking has the potential to accelerate digitalisation. And fourth, teleworking may have an adverse impact on the way teams work together, as working from home is perceived by some to decrease interaction, team spirit and synergies among colleagues. The available data show that the negative productivity impacts of teleworking increase with teleworking intensity. For that reason, the literature suggests an inverted U-shaped relationship between the amount of telework and worker efficiency, implying that productivity growth is maximised at moderate levels of teleworking.[14] The exact form of this relationship likely varies with the relative importance of these factors by sector and by occupation.
Chart 6
E-commerce and teleworking
a) Retail trade turnover
(deflated; index 2019 = 100)
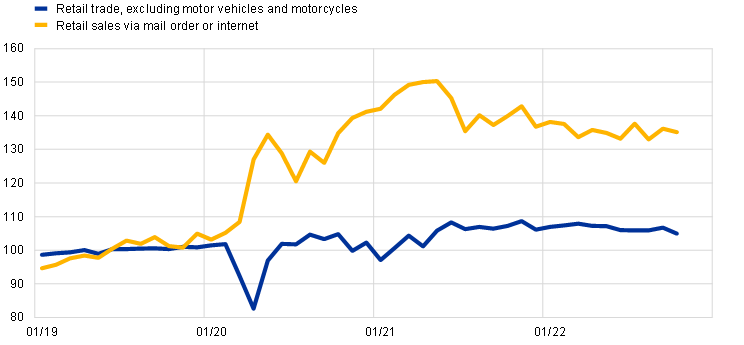
b) Share of employees teleworking
(% of employed persons aged 15 years and older)
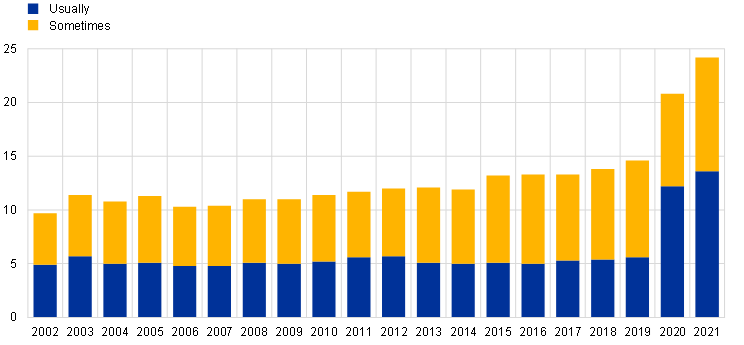
Source: Authors’ calculations based on Eurostat data.
Notes: Retail sales via mail order or internet includes retail sale activities where the buyer makes their choice on the basis of advertisements, catalogues, information provided on a website, models or any other means of advertising and places their order by mail, phone or over the internet. Latest observation: October 2022.
The pandemic may have affected the labour force with longer-lasting scarring that extends beyond the acute phase. First, school shutdowns and disruptions to education during the pandemic may have had an impact on the human capital of future workers. Second, in the current workforce, pandemic containment measures and sharply reduced output may have raised unemployment rates, disrupted firm-worker relationships and potentially reduced skills and human capital. Finally, some people infected by COVID-19 may have acquired a chronic health condition that impairs their ability to work for a prolonged period. That said, job retention schemes and the provision of online schooling likely reduced the impact of the pandemic crisis on the labour force, and the return of the euro area labour force to its long-run pre-pandemic trend in 2023 argues against substantial permanent effects.[15]
3 The impact of the digital and green transitions
The ongoing digital and green transformations of the economy are high on the policy agenda in Europe. The NGEU funds support the adoption of greener technologies and the digitalisation of the economy, which have been accelerated by the pandemic and the recent increase in energy prices. This twin transition is expected to affect euro area productivity growth in the short and medium term. Furthermore, the ongoing development and spread of artificial intelligence (AI) in euro area economies gives rise to a host of opportunities and new challenges to exploit AI’s productivity-enhancing potential. The EU Fit for 55 package[16] was designed to accelerate the green transition, and along with the recent energy shock in the context of the Russian invasion of Ukraine, is altering the relative prices of the various energy inputs. Although the costs of the transition to a low-carbon economy will always be lower than inaction, it is important to understand how these changes affect the production decisions and performance of the corporate sector. Higher input costs from increasing energy and carbon prices are likely to dampen short-term productivity growth. This negative impact could be offset in the longer term by adopting new, greener and more digitally adept technologies.
The digital transition
The digital transition has become a policy priority for the European Union.[17] Moreover, the pandemic has accelerated digitalisation. In addition, generative AI has been showcasing the potential – which is still to be seen – of new digital technologies to alter the ways in which people live and work.
One of the main reasons that the European Union has an interest in the digital transition is because of the productivity-enhancing potential of digitalisation. Digitalisation affects firm productivity growth through various channels. On the workers’ side, the literature shows that the adoption of digital technologies leads to a boost in workers’ efficiency by complementing their tasks, while non-core tasks are more likely to be outsourced after the arrival of the new technology.[18] Various studies have also documented the impact of digitalisation on markets: digital technologies allow firms to grow quickly and achieve scale without mass[19], increase competitiveness and market size through the potential of e-commerce and access wider choices of imported goods.[20]
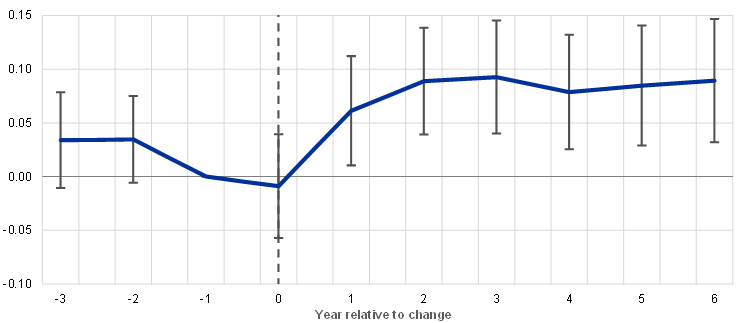
Investing in digital technologies increases firm-level productivity. Firm-level data analysis from France and Austria shows that, after an adjustment period, firms that invested more in digital technologies enjoyed sustained and significantly higher productivity growth than firms that invested less in digital technologies (Chart 7).[21] In the very short term, adopting these new technologies implies structural changes in the production process, which could be detrimental to productivity. Indeed, employment rates react faster than production because firms need to hire employees able to perform new tasks, such as IT jobs. This explains the initial drop in labour and, above all, total factor productivity (TFP) growth in the year of the technology investment.
However, the estimated effect of digital uptake on firm-level productivity in the two countries included in the analysis is small (Chart 7). The estimated reaction of firm productivity to the uptake of digital technology indicates that, on average, a 1% increase in investment in digital technologies would lead to a 0.06% increase in labour productivity and a 0.007% increase in TFP after six years. These estimates probably represent a lower bound for at least four reasons: (1) they are micro-based elasticities estimated at the firm level, which means that spillovers and general equilibrium effects are not included, although they can be important, as will be discussed below; (2) the data for the exercise refer to the period before the introduction of the latest generation of AI technologies, and in particular generative AI, which might have a higher productivity impact; (3) new digital technologies may require investment in the complementary skills of workers and managers, appropriate infrastructure and legal frameworks, and intangibles (e.g. data and software) to deliver full productivity benefits; and (4) the average impact masks heterogeneous impacts across sectors and across firms within the same sector.
Chart 7
Impact of digital uptake on firm-level productivity growth over time
a) Labour productivity
(estimated semi-elasticity)
b) Total factor productivity
(estimated semi-elasticity)
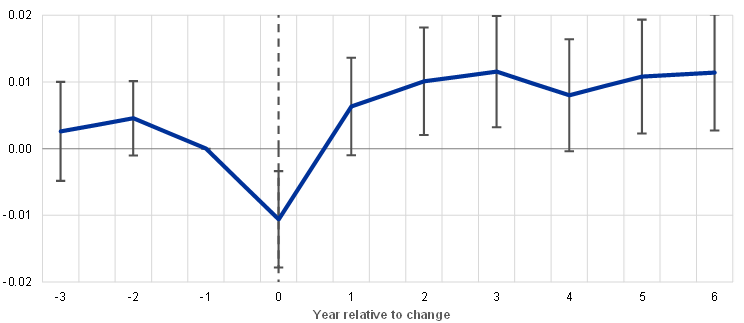
Source: Authors’ calculations based on FIBEN dataset (France).
Note: The chart refers to the results based on French firm-level data, although results for Austria are qualitatively similar. The chart shows the average difference in productivity growth up to six years after the investment between two groups of firms: firms that invested a lot in digitalisation and firms that invested less in digitalisation. The whiskers represent a 95% confidence interval.
Analysis using firm-level data for 13 euro area countries confirms that the productivity gains from digitalisation are highly heterogeneous across sectors and firms. The estimates suggest that a 1 percentage point higher digital investment intensity in a sector is associated with an acceleration the next year of roughly 0.02 percentage points in TFP growth of the average firm in that sector. Hence, the magnitude of the impact of digital investment seems rather small, corroborating the previous results for France and Austria. However, average impacts mask high heterogeneity across sectors: the impact in sectors able to benefit from digitalisation (blue and yellow dots in Chart 8, panel a) is 17 times larger than the average productivity impact estimated across all sectors.
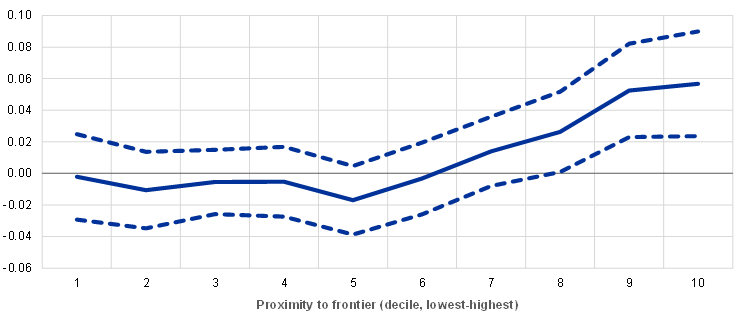
Only the most productive firms benefit in terms of TFP growth from higher digital intensity (Chart 8, panel b). Only about 30% of firms, the most productive ones in the sector, manage to use new digital technologies in innovative and even disruptive ways to increase their productivity over time. Indeed, these firms already have internal processes that are highly productive, and digitalisation is another advantage that gives them a competitive edge. For other firms, digitalisation has no significant impact on their productivity.[22]
However, aggregate impacts of digitalisation on productivity growth, after taking into account spillovers and general equilibrium effects, can be sizeable. To understand the importance of general equilibrium effects, a multi-sector dynamic stochastic general equilibrium model calibrated for the four largest euro area economies is used. In this model, sectoral output is used not only for consumption or investment purposes, but also as an intermediate input to capture inter-sector linkages.[23] Labour productivity growth resulting from observed TFP growth in each sector between 1997 and 2018 is compared with a counterfactual scenario in which TFP growth in digital sectors is set to zero from 1997[24]; that is, a counterfactual with no digitalisation.[25] It is found that in Germany and France, respective labour productivity growth would have been about 50% and 40% lower, respectively, in cumulative terms since 1997, without digitalisation-related efficiency increases.[26] Aggregate labour productivity in Italy would have stagnated. Overall, the simulation results highlight the high impact of TFP growth in digital sectors – as a proxy for digitalisation – on aggregate labour productivity growth, and the importance of spillovers and general equilibrium effects.[27]
Chart 8
Heterogeneous impacts of digitalisation on TFP growth across sectors and firms
a) Estimated impact of digitalisation on TFP growth in different sectors
(percentage points)
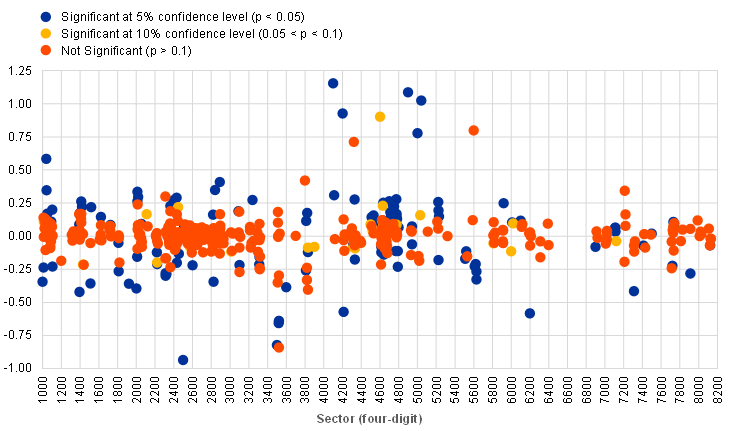
b) Estimated impact of digitalisation on TFP growth in firms with different initial TFP levels
(Percentage points)
Source: Anderton et al.1)
Notes: Panel a) shows the impact of digitalisation on sector TFP growth; sectors are defined at the 4-digit NACE level. Panel b) shows the sector-specific impact of digitalisation on firm TFP growth, depending on the position of the firm in the TFP distribution (1 is the lowest decile of the TFP distribution and 10 is the highest).
1) Anderton, R., Botelho, V. and Reimers, P., “Digitalisation and productivity: gamechanger or sideshow?”, Working Paper Series, No 2794, ECB, Frankfurt am Main, March 2023.
The green transition
Transition risks refer to the impacts of mitigation policies that are needed to achieve a greener society. Such policies, which implement carbon reduction objectives, lead to changes in the energy and industrial system and have impacts throughout the economy. For example, firms involved in fossil fuel production and those with a high emission intensity could face higher business costs and/or high costs to invest in carbon mitigating technologies. Also, higher prices of intermediate inputs can result in a notable rise in the production costs of less polluting firms. Overall, the entire economy will have to adjust.
A “disorderly transition” would reduce aggregate productivity over the long term. Green capital requires technological development and investment, which itself is a gradual process that depends on resource availability. The pace of the transition therefore matters. If carbon prices increase in a gradual and predictable manner (“orderly transition”), obsolete capital can be replaced with new green capital when it has depreciated. If the investment effort is uncertain, and transition policies unpredictable or pushed to the future, carbon prices will have to rise sharply to reach carbon neutrality (“disorderly transition”). This can result in substantial losses of capital, output and productivity in the long term.
While transition policies are aimed at greenhouse gas (GHG) emission reduction, they can also have an impact on short- to medium-term productivity growth.[28] There are multiple potential channels for this impact. First, transition policies can reduce the flexibility with which firms operate. Second, new green technologies might be less efficient than existing carbon-intensive ones. Third, investment in green technologies might crowd out other productivity-enhancing investment. Fourth, the green transition may result in the reallocation of resources from high-polluting sectors and firms to low-polluting sectors and firms, which might differ in their average productivity level. Fifth, higher investment in green technologies and innovation could have a positive impact on aggregate productivity growth over the long term. Sixth, the green transition could affect the skill composition of the labour force, with a possible bearing on aggregate productivity growth.
Observed changes in firm productivity may be partly a measurement issue. Carbon-intensive technologies currently underestimate their climate change impact in productivity calculations. This is because environmental degradation and the increased risk of climate-related disasters are not included as costs in traditional accounting frameworks. Therefore, green technology that avoids these unaccounted costs may only appear less productive. Similarly, capital put in place solely to abate carbon emissions does not have a measured output. If carbon abatement is achieved by adding a step (e.g. carbon capture) to the existing production process, there is, by definition, a need for more capital and inputs to reach the same measured output. Assessing productivity based on GDP per employee or per hour worked falls short in capturing the full benefits of embracing green technology. This limitation becomes evident, particularly as these metrics fail to account for the relevant counterfactual scenario of a probable escalation in climate-related physical risks.
Transition policies, firm productivity growth and innovation
A potential positive aspect of the green transition is that an increase in investments in green innovations and technologies could lift productivity growth over the medium to long term. This is known as the Porter hypothesis.[29] The “strong” version of the Porter hypothesis states that increases in environmental regulation stringency raise overall productivity, while the “weak” version holds that optimally designed environmental regulation spurs innovation. A third, “narrow” version predicts market-based tools to be more effective in boosting innovation than “command-and-control” policies. Although there are many empirical analyses that test the validity of the versions of the Porter hypothesis, results remain inconclusive.
Firm-level data from six euro area countries have been used to test the Porter hypothesis. Results show that the productivity growth of high-polluting firms declines as environmental policy becomes more stringent.[30] The impact can be relatively large: a one standard deviation tightening of the regulation decreases TFP growth by about one-third over five years. However, the impacts are different across policy types. Technology support policies (green R&D subsidies) only have a short-term negative effect in a transition period before boosting TFP growth.[31] In contrast, market policies – for example, the Emissions Trading System or taxes – have persistent and negative, albeit quantitatively small, effects. Conversely, non-market tools such as emission limits reduce TFP growth the most over the horizon of five years. Compared with market-based policies, the significant negative impacts of non-market policies on TFP could result from their more discretionary nature.[32]
More stringent environmental policies increase the amount of green patent applications from polluting firms (Chart 9, panel a). Moreover, the increase in investment in green innovation does not crowd out other types of innovations, as shown by the non-significant impact of more stringent policies on other non-green patent applications (Chart 9, panel b). These results confirm the weak version of the Porter hypothesis, which states that stringent environmental policy can increase overall innovation.
The analysis shows that market-based instruments, such as carbon taxes, are necessary but not sufficient to spur investment in green innovation and productivity growth. The green transition also requires stepping up green R&D efforts and non-market policies such as standards and regulations. Similarly, survey-based evidence[33] shows that other factors related to reputational risks and demand are also important in driving corporate green performance.
The impact of environmental policies on TFP growth varies across firms. Firm-level data on the same six euro area countries show that small firms bear significantly higher TFP growth costs than large firms when environmental policy becomes tighter. This difference is shown to reflect, among other things, the capacity of large firms to access the required financial resources to successfully replace carbon-intensive capital.[34]
Chart 9
Change in green and non-green patent applications of polluting firms after tightening environmental policy
a) Green patents (by year of first filing) | b) Other patents (by year of first filing) |
|---|---|
(percentage points) | (percentage points) |
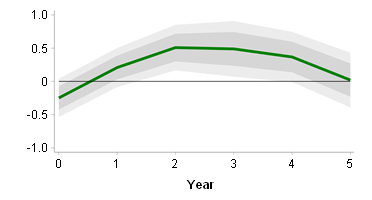 | 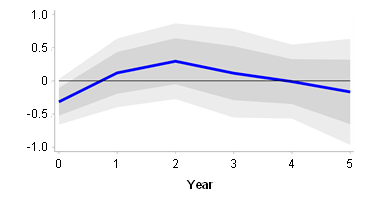 |
Source: Benatti et al.1)
Notes: Firm-level impulse response functions of positive environmental policy stringency (EPS) changes on green patent families filed by polluting firms in Belgium, Germany, Spain, France, Italy and Portugal, estimated using local projections.[35] Data on patent applications are from the Orbis IP database. Patent information was matched with firm-level performance indicators for about 100,000 firm-year observations in the initial dataset, given that only a minority of firms apply for patents. The Cooperative Patent Classification (CPC) is used to classify the patented technologies in different groups. Green innovations refer to climate change mitigation technologies.
1) Benatti, N., Groiss, M., Lopez-Garcia, P. and Kelly, P., “Environmental regulation and innovation: are there crowding out effects?”, forthcoming as an ECB Working Paper.
Transition policies and resource reallocation
Climate-driven reallocation of resources may also affect aggregate productivity growth. Emission reduction can be achieved by incentivising the adoption of greener technologies and through green reallocation, i.e. by shifting economic activity away from the most polluting firms towards the least polluting ones. The impact of green reallocation on aggregate productivity depends on the productivity of carbon-intensive sectors and firms compared with that of their greener counterparts.
High carbon-intensive sectors are, on average, relatively more productive than greener ones. Sectors such as mining and refineries are expected to shrink due to increasing relative prices and have a higher level of labour productivity than sectors that are involved in making buildings more energy-efficient and are expected to grow. Therefore, the reallocation of production factors across sectors during the green transition will mechanically, at current productivity levels, decrease aggregate productivity.
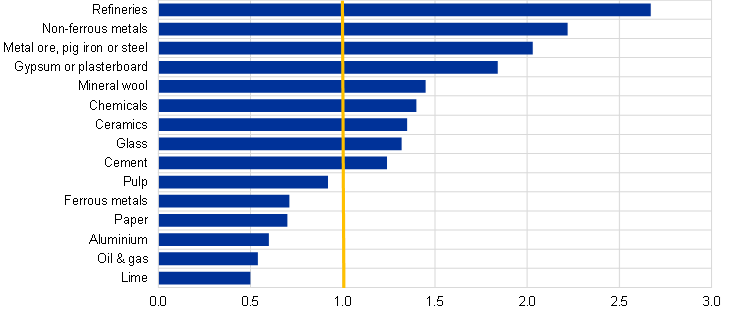
The effects of within-sector reallocation of resources are less clear and vary across sectors. Firm-level carbon intensity and labour productivity are not necessarily correlated. Therefore, reallocating output from high to low carbon-intensive firms does not necessarily lead to increased productivity. Firm-level information from the EU Emissions Trading System (ETS) for the period 2005-2020 shows that in the majority of sectors, the most carbon-efficient firms are also the most productive ones. At current firm-level productivity levels, reallocation of output towards greener firms will result in increases in labour productivity growth in those sectors, all other things being equal. However, for other sectors such as pulp, paper and ferrous metals, the contrary is the case, and the reallocation will be productivity-decreasing (Chart 10, panel a).[36]
Reallocation of factors of production within firms away from energy may lead to lower productivity. Models that include energy in the production function show that higher energy prices can result in firms substituting away from energy and increasing their use of capital and labour. Due to diminishing marginal returns, the overall impact would be lower productivity and output. Indeed, recent OECD work estimates that a 5% increase in energy prices leads to firm productivity dropping by approximately 0.4% one year later as a result of the downward adjustment of the firm’s capacity utilisation.[37] The firms most affected are those operating in energy-intensive sectors, as well as firms that are financially constrained.
Chart 10
Reallocation of resources and labour productivity
Labour productivity of the 20% most carbon-efficient firms versus labour productivity of the 20% least carbon-efficient firms in each sector
(ratio)
Source: Authors’ calculations based on ETS-Orbis data.[38]
Note: “Firms” refers to firms within the EU ETS. Sectors where the blue bar passes the yellow line will benefit from a carbon driven reallocation as the least carbon-intensive firms are the most productive. For the sectors that do not pass the yellow line, the opposite is the case.
4 Concluding remarks: euro area productivity growth over the medium term
Over the past few years, the euro area economy has been hit by a series of shocks. The COVID-19 pandemic and the energy shock following Russia’s invasion of Ukraine have interacted with other current structural trends, including the ongoing green and digital transitions. The overall impact of these shocks on the medium-term productivity prospects of the euro area is uncertain and varies depending on the time horizon.
The generous and swift policy responses at the national and European levels to the pandemic and the related lockdown measures helped to contain the size and duration of scarring effects on households and firms. Although productivity-enhancing reallocation of resources was not severely distorted in 2020, the pandemic and the policy support reduced the cleansing effect of the crisis compared with previous crises.
The pandemic accelerated the digitalisation of the economy and NGEU funds provided support in this regard. Digital adoption by corporates has been shown to foster productivity growth. However, firm-level impacts of digitalisation have been relatively modest to date. One of the main reasons for this is that only few firms – the ones closer to the technology frontier – have benefited most from digitalisation. Other firms need to invest more in relevant digital skills and complementary intangibles to fully reap the productivity gains from digitalisation. This process will only be reflected in aggregate productivity gains over the longer term.
The green transition may still boost productivity growth, but it will take time. In the short to medium term, the adjustment of firms to the change in relative input prices driven by carbon taxes or by geopolitical tensions, in addition to new limits and standards, and the scrapping of carbon-intensive capital, will reduce emissions as intended but is also likely to reduce productivity growth. Also, the reallocation of resources away from carbon-intensive sectors and firms might have a negative short-term impact on productivity. However, more stringent environmental policies are expected to trigger a new wave of green innovation and new environmental technologies that raise productivity growth over the long term.
The analysis has been published as Anghel, B., Bunel, S. et al., “Digitalisation and productivity: a report by the ESCB expert group on productivity, innovation and technological change”, Occasional Paper Series, No 339, ECB, Frankfurt am Main, February 2024; Bijnens, G. et al., “The impact of climate change and policies on productivity: a report by the ESCB expert group on productivity, innovation and technological change”, Occasional Paper Series, No 340, ECB, Frankfurt am Main, February 2024; Lalinsky, T. et al., “The impact of the COVID-19 pandemic and policy support on productivity: a report by the ESCB expert group on productivity, innovation and technological change”, Occasional Paper Series, No 341, ECB, Frankfurt am Main, February 2024.
See Work stream on productivity, innovation and technological progress, “Key factors behind productivity trends in EU countries”, Occasional Paper Series, No 268, ECB, Frankfurt am Main, September 2021.
See the box entitled “The impact of the COVID-19 pandemic on labour productivity growth”, Economic Bulletin, Issue 7, ECB, 2021.
The countries covered are Estonia, Greece, Spain, France, Croatia, Italy, Luxembourg, Netherlands, Portugal, Slovenia, Slovakia and Finland.
In Greece the contribution of the reallocation of resources across firms is slightly negative. However, Greece is the only country in which productivity is measured as revenue per employee, rather than value added per employee. This could affect the comparability of the results with the other countries.
The lower rate of firm exits during the acute phase of the pandemic could also reflect the expectation that the COVID-19 crisis would be short-lived.
The countries for which 2020 data are available are: Estonia, Spain, Croatia, Portugal, Slovenia and Slovakia.
For cross-country and other details, please see Lalinsky, T. et al., “The impact of the COVID-19 pandemic and policy support on productivity: a report by the ESCB expert group on productivity, innovation and technological change”, Occasional Paper Series, No 341, ECB, Frankfurt am Main, February 2024.
Note that only Croatia, Latvia and Slovakia had firm-level data on wage subsidies and firm characteristics for 2021. Therefore, the results referring to the allocation of support in 2021 are based on a small sample of countries and should be treated with caution.
See the analysis reported in Valderrama, M.T. et al., “The impact of monetary policy on productivity: A report of the ESCB Expert Group on Productivity, Innovation and Technological Change”, Occasional Paper Series, 2024, forthcoming.
Organisation for Economic Co-operation and Development, “One year of SME and entrepreneurship policy responses to COVID-19: Lessons learned to ‘build back better’”, OECD Policy Responses to Coronavirus (COVID-19), 2021.
Aksoy, C.G., Barrero, J.M., Bloom, N., Davis, S.J., Dolls, M. and Zarate, P., “Time Savings When Working from Home”, NBER Working Paper, No 30866, January 2023.
Bergeaud, A. and Ray, S., “The macroeconomics of teleworking”, Banque de France Bulletin, No 231/2, 2020.
See, for example, Behrens K., Kichko, S. and Thisse, J.-F., “Working From Home: Too Much of a Good Thing?”, CESifo Working Papers, No 8831, 2021 and Albanesi, S., Dias da Silva, A., Jimeno, J.F., Lamo, A. and Wabitsch, A., “New technologies and jobs in Europe”, Working Paper Series, No 2831, ECB, Frankfurt am Main, 2023.
See Lam, W.R. and Solovyeva, A., “How effective were job-retention schemes during the COVID-19 pandemic? A microsimulation approach for European countries”, IMF Working Paper 2023/003, International Monetary Fund, 2023 and the article entitled “The euro area labour force: recent developments and drivers”, Economic Bulletin, Issue 6, ECB, 2023.
Fit for 55 is a set of proposals that aims to reduce the EU’s net greenhouse gas emissions by at least 55% (compared with 1990) by 2030.
As documented by various policy initiatives such as the European Union’s Digital Single Market Strategy and Next Generation EU project.
See, for example, Gal, P. et al., “Digitalization and Productivity: In Search of the Holy Grail - Firm-level Empirical Evidence from European Countries”, International Productivity Monitor, Centre for the Study of Living Standards, Vol. 37, 2019, pp. 39-71.
“Scale without mass” refers to the possibility of carrying out significant business activities without meeting criteria for a permanent establishment in the jurisdiction.
See, for example, Haskel, J. and Westlake, S., Capitalism without Capital: The Rise of the Intangible Economy, Princeton University Press, 2017.
The analysis uses an event methodology in which the event is a large investment (within the top 10% of the distribution) in digital technology. The specification includes controls for time-invariant unobservable country, sector and firm-specific variables as well as industry-year fixed effects to address some of the potential correlated demand or supply shocks. For more information on the methodology, refer to Aghion, P., Antonin, C., Bunel, S. and Jaravel, X., “What Are the Labor and Product Market Effects of Automation? New Evidence from France”, Sciences Po publications, 2020.
The analysis uses Orbis data for 13 euro area countries between 2000 and 2019, including about 2.5 million firms, to estimate the impact of sector digital intensity on firm-level TFP growth after controlling for other possible determinants of productivity growth at the firm level. For details refer to Anderton, R., Botelho, V. and Reimers, P., “Digitalisation and productivity: gamechanger or sideshow?”, Working Paper Series, No 2794, ECB, Frankfurt am Main, March 2023.
A detailed description of the model can be found in Deutsche Bundesbank, “The impact of digitalisation on labour productivity growth”, Monthly Report, Vol. 75, No 3, March 2023, pp. 43-65.
Digital sectors comprise the economic sectors “Manufacture of computer, electronic and optical products” (NACE division C26), “Manufacture of electrical equipment” (NACE division C27) and “Information and communication” (NACE section J).
Note that this is a very strong assumption as TFP growth in digital sectors could be related to reasons other than digitalisation.
Results for Spain are not shown as the model deviates noticeably in some parts from the actual path of labour productivity. One reason for this is probably the fact that labour productivity in Spain increased considerably as a result of the disproportionately large reduction in labour input in the wake of the global financial and economic crisis and the subsequent sovereign debt crisis. However, this dramatic development is not triggered by TFP and therefore cannot be inferred from the model.
The micro-based elasticities of productivity to digitalisation are much smaller than the ones implied by the model because they do not account for entry and exit, sector spillovers and other equilibrium effects.
See also the article entitled “How climate change affects potential output”, Economic Bulletin, Issue 6, ECB, 2023.
Porter, M.E. and van der Linde, C., “Toward a New Conception of the Environment-Competitiveness Relationship”, The Journal of Economic Perspectives, Vol. 9, No 4, 1995, pp. 97-118.
Data for Belgium, Germany, Spain, France, Italy and Portugal between 2003 and 2019. The reported findings draw on the results of two ECB working papers: Benatti, N., Groiss, M., Kelly, P. and Lopez-Garcia, P., “Environmental regulation and productivity growth in the euro area: testing the Porter hypothesis”, Working Paper Series, No 2820, ECB, Frankfurt am Main, 2023 and Benatti, N., Groiss, M., Lopez-Garcia, P. and Kelly, P., “Environmental regulation and innovation: are there crowding out effects?”, forthcoming. The analysis uses estimated firm-level CO2-equivalent emissions to identify firms most exposed to environmental policy changes, and thereby identify causal impacts. The changes in environmental policy are measured with the OECD Environmental Policy Stringency Index (EPS) and take into account information on three different types of environmental policies: market-based policies, non-market-based policies and green R&D support policies. A large set of controls for unobserved heterogeneity are included to minimize omitted variable bias.
The initial negative impact of investment in new technology and innovation on TFP is also found in the context of investment in digital technologies (see Chart 7).
Blanchard, O., Gollier, C. and Tirole, J., “The portfolio of economic policies needed to fight climate change”, Annual Review of Economics, Vol. 15, 2023, pp. 689-722.
Based on analysis of Eurostat’s Community Innovation Survey 2020.
Benatti, N., Groiss, M., Kelly, P. and Lopez-Garcia, P., “Environmental regulation and productivity growth in the euro area: testing the Porter hypothesis”, Working Paper Series, No 2820, ECB, Frankfurt am Main, 2023.
Jordà, Ò., “Estimation and Inference of Impulse Responses by Local Projections”, The American Economic Review, Vol. 95, No 1, 2005, pp. 161-182.
Transition policies might also affect reallocation of resources through entry and exit of firms. Model-based analysis shows that higher carbon taxes raise the productivity threshold for entering the market and increase firm exit rates; see Chafwehe, B., Colciago, A. and Priftis, A., “Carbon Taxation, Monetary Policy and Productivity”, forthcoming. In addition, empirical analysis using matched data from EU ETS and Orbis shows that a sharp increase in carbon prices to €150 for all emissions within the EU ETS, assuming constant carbon intensity and no pass-through of the increased carbon cost, could put at least one-tenth of manufacturing firms currently covered by the ETS in major euro area economies at risk of making losses. See Bijnens, G. et al., “The impact of climate change and policies on productivity: a report by the ESCB expert group on productivity, innovation and technological change”, Occasional Paper Series, No 340, ECB, Frankfurt am Main, February 2024.
André, C. et al., “Rising energy prices and productivity: short-run pain, long-term gain?”, OECD Economics Department Working Papers, No 1755, OECD Publishing, Paris, 2023.
Bijnens, G. and Swartenbroekx, C., “Carbon emissions and the untapped potential of activity reallocation: lessons from the EU ETS”, NBB Economic Review, 2022, pp. 1-28.