

How climate change affects potential output
Published as part of the ECB Economic Bulletin, Issue 6/2023.
1 Introduction
Climate change and the actions taken to tackle it will profoundly change economic activity in the coming decades. Eliminating carbon emissions requires changes to how people consume and how businesses produce. Without sufficient progress in reducing emissions, average temperatures will increase, sea levels will rise, and climate extremes will become more frequent and more powerful.[1]
One common approach to estimating the economic impact of climate change uses scenarios with consistent paths for carbon emissions and climatic conditions.[2] While such estimates depend on the exact scenario, the general conclusion is that unmitigated climate change is substantially worse for potential output over the long run than the impact of the transition to net-zero carbon. Yet the transition itself may also reduce potential output, particularly in the near term. Well-conceived, well-communicated and well-coordinated policies can help alleviate these negative impacts.[3]
This article takes an alternative approach by detailing the channels of impact on potential output, drawing on the existing literature and ongoing work at the ECB. Knowledge of these channels can help frame policy discussions and improve the modelling of the economic impacts of climate change. Those impacts can be broadly separated into three categories.
- long-run climate change, including higher average temperatures, changes to precipitation, rising sea levels and adaptation measures taken to reduce its impact;
- extreme weather and climate events, such as droughts, heatwaves, wildfires, windstorms and floods;
- the transition to a net-zero carbon economy, including notably the impact of policies enacted to accelerate the transition, such as carbon taxes and regulation.
2 What is potential output?
Potential output is an important concept for monetary policy. It represents the highest level of output that an economy can sustain over the medium term.[4] Actual output can diverge from potential output, with the difference between the two called the output gap. When the output gap is positive (actual output exceeds potential), there is generally upward pressure on the cost of factors of production, resulting in higher consumer prices and necessitating tighter monetary policy. Correspondingly, a negative output gap tends to put downward pressure on inflation. So while potential output is not directly observable, estimating its value plays an important role when assessing current economic conditions and determining the monetary policy stance.
Three main components contribute to potential output.
- Capital stock: all assets – both physical and intangible – used as part of the production process. This includes buildings, machinery, software and patents as well as public infrastructure, such as roads.
- Labour supply: the total number of hours worked in the economy. This is a function of the number of people participating in the labour force, structural causes of unemployment and average hours worked per worker.
- Total factor productivity (TFP): how effectively capital and labour are used in the production process, reflecting both technology and managerial capabilities.
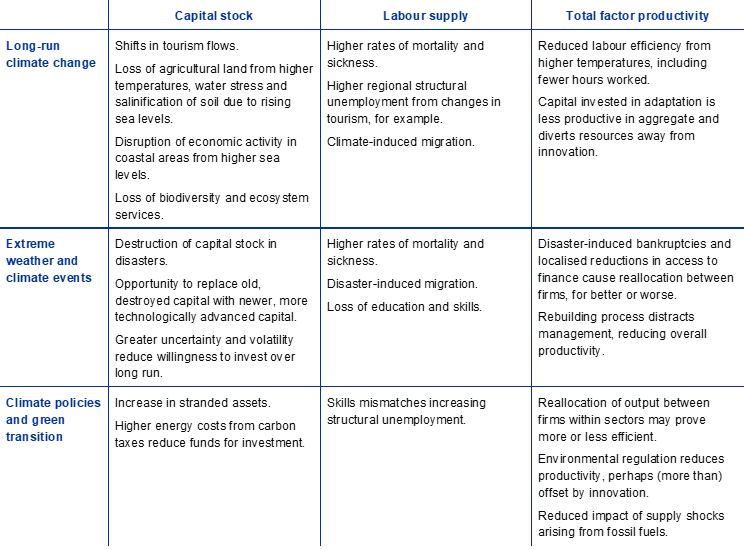
Some impacts of climate change on potential are readily visible, such as the destruction of physical capital during catastrophes; other impacts can be less obvious. Yet these other effects can be just as critical for the long-run impact of climate change. Table 1 briefly summarises the main channels of impact, which are covered in more detail below. Moreover, how climate change affects biodiversity is not always captured in traditional economic models nor in measures of economic activity such as GDP. This is discussed in Box 3.
Table 1
The impact of climate change on the components of potential output
Not every channel affects potential output at the medium-term horizon that matters most for monetary policy. Some slow-moving impacts can substantially reduce potential over the long run but may not greatly influence inflation. Short-term impacts, such as temporary dislocation following disasters or supply chain disruptions of critical minerals, may imply alternative monetary policy prescriptions than medium-term variations.[5] Regardless of the impact horizon, the combination of channels described here increases uncertainty and makes it harder for central banks to accurately estimate potential output during the macroeconomic projection process that supports monetary policy decisions.
3 The impact of long-run climate change
Long-run changes in average temperatures and precipitation patterns are likely to negatively affect certain sectors and regions across Europe. Tourism is one example. Warmer winters are expected to reduce the availability of snow for skiing. Similarly, many Mediterranean regions are currently ideal for summer tourism, but higher average temperatures and reduced availability of fresh water during the high season would substantially reduce their suitability.[6] The overall impact for southern Europe depends on whether tourists will change the timing of their holidays as more spring and autumn months may become viable. Coastal regions in the Mediterranean are also vulnerable to greater risks of flooding from rising sea levels. These changing conditions are likely to reduce the value of tourist-related capital (such as hotels) in affected regions and shrink future investment rates.
Agriculture is also expected to be affected, with southern Europe in particular facing lower crop yields. By contrast, yields may increase in some areas of northern Europe. Opportunity exists to switch crop species to adapt to higher temperatures, but water supply is expected to constrain options, notably in southern Europe.[7] Moreover, even if crops are adapted to the changes in average temperatures and precipitation, the widening of the distribution of outcomes relative to those averages may also reduce yields. That said, the value of European agricultural products may increase if other food-producing regions in the world suffer more seriously from climate-related impacts.
Higher temperatures reduce the productivity of, and hours worked by, individual workers. Workers are typically at their most productive in the comfort range of 19-22°C, with efficiency declining non-linearly beyond that range.[8] Workers in industries highly exposed to temperature, such as construction, have been shown to reduce their time worked on hot days.[9] And it is not just physical jobs that are affected: heat can also impair mathematical ability above certain thresholds.[10]
Given the non-linear impact, labour supply will be more affected by rising temperatures in countries that are on average already hotter.[11] Since low-income countries (or regions) tend to have hotter climates and specialise in climate-exposed sectors such as agriculture and tourism, rising global temperatures are likely to exacerbate income inequalities between countries and regions. Within Europe, a marginal increase in temperature could boost labour productivity growth in cooler countries, but the impact turns negative once the average historic temperature exceeds 14°C, approximately that of Italy and France.[12]
Higher temperatures may result in more deaths, although adaptation using technology may temper the impact on labour supply. The 2022 summer heatwave in Europe is estimated to have caused 60,000 heat-related deaths.[13] The relationship between mortality and temperature is in fact U-shaped.[14] Fewer deaths from extremely cold days that should become less frequent partly offset the increase in mortality arising from more heat-related deaths. Moreover, there is some evidence of declining mortality rates, attributed to greater use of air conditioning.[15] Yet claims that technology will mostly eliminate the negative impacts of higher temperatures should be treated with caution. The exact same constraints of access and income that currently prevent the full use of long-standing technologies (such as heating to protect from the cold) are also likely to constrain the widespread use of new technologies in the future.
Climate change could also affect labour supply through climate-induced mortality, morbidity and migration, with Europe likely seen as a highly desirable destination. Higher average temperatures are projected to result in greater rates of sickness.[16] Estimates of the potential future impact of climate on labour migration vary substantially.[17] Historically, only some of those affected by climate events relocate, and most that do are displaced internally rather than emigrating.[18] Yet historical experience of certain regions within countries becoming temporarily inhospitable may be a poor guide if entire countries become permanently so.
In the long run, adaptation can mitigate the impact of climate change on output. Measures such as sea walls, irrigation and relocating activity to less vulnerable locations increase the resilience of the economy to climate change. Yet standard productivity measures do not capture averted output losses, so the effectiveness of the capital stock may appear to decline if more capital is devoted to this task. Allocating resources to adaptation may also reduce the resources available for innovation and hence slow future TFP growth.
4 The impact of extreme weather and climate events
Extreme events typically reduce economic activity in the near term, but the long-run impact is less certain. The initial shock is followed by a period of disruption and uncertainty that gradually gives way to recovery. Factors reducing the short-term impact include higher income per head, higher literacy levels and better institutions.[19] Cash inflows to affected areas (e.g. international aid, fiscal transfers, credit and insurance) cushion the impact and support the recovery.[20] The long-run impact relative to pre-disaster trend growth is more nuanced and can differ between the regional and national levels.
Some countries have been able to build back better by seizing the opportunity to invest in new capital and technologies.[21] But this normally only occurs following mild or moderate events in relatively richer emerging market economies with close trade links to advanced economies.[22] For poorer countries, or after severe events, there is at best a return to trend, and often an incomplete recovery.[23]
The destruction of capital stock is the most visible impact of extreme events on potential output. Floods, windstorms and wildfires destroy buildings, machinery, roads and other infrastructure. Infrastructure damage amplifies the impact on potential output by spreading the effects to businesses that initially avoided damage. Output in primary industries can be durably affected by reduced land viability, such as through soil erosion. The lack of feed during droughts can lead to substantial livestock culls from which herds may take years to recover.
Insurance coverage and access to finance play an important role in underpinning the recovery and lessening the impact on long-run output. Companies with business interruption insurance show better productivity growth and profitability following disasters than those without such policies. But only if the payout is prompt: funding that arrives too late is little better than no funding at all.[24] Moreover, if access to finance is not generally correlated with productivity – if only large businesses can still obtain credit, for example – businesses that are otherwise productive and viable may go bankrupt, further reducing potential output.[25]
The long-run impact is generally more pronounced in the affected regions as workers – typically younger and more skilled – often leave and may be slow to return.[26] One year after Hurricane Katrina devastated New Orleans, there were fewer children relative to population, the average education level declined, and the median age increased by six years.[27] The impact of this emigration may persist for decades. Heavily eroded counties in the Dust Bowl era of the 1930s in the United States witnessed significant outward migration. The price of farmland fell by around 30% relative to less eroded counties, reducing collateral and overall access to finance. The economic effects lasted for more than half a century, even though soil quality recovered much faster.[28]
The outflow of workers from affected regions can, conversely, boost labour supply and hence potential output in other regions, tempering the overall national impact. Searching for new positions and moving are costly, but the break caused by extreme events provides an opportunity to reassess. Indeed, workers who left following Hurricane Katrina ended up on average with higher earnings elsewhere.[29] Yet this experience is not universal. Disasters can reduce educational attainment in affected cohorts, durably lowering human capital. Since parental educational attainment also influences that of their children, the impact can transfer across generations.[30]
Extreme events can also reduce TFP growth over the long run. Even businesses in affected regions that maintain higher rates of capital investment and employment growth still have lower TFP growth over the medium term, suggesting that reconstruction distracts management and disrupts efficiency.[31] Moreover, while patents for adaptation to extreme events increase somewhat following disasters, other types of innovation slow down, resulting in lower long-term TFP in affected regions.[32]
Finally, climate change needs to be considered in the context of more frequent events, rather than taking each event in isolation. Several authors have highlighted channels through which a higher frequency of extreme events results in lower potential output over time.[33] For example, the greater uncertainty could result in households and businesses becoming more cautious and reducing capital investment. Depending on the assumptions of the frequency and magnitude of future disasters, expected annual output growth could fall by between 0.25 and 1 percentage point.[34]
5 The impact of climate policies and the green transition
Swift action to cut emissions and the transition to a net-zero carbon global economy are required to reduce the impacts of long-run climate change on output. Over the long run, a global transition to net-zero carbon is projected to deliver higher output compared with a scenario of no transition.[35] Yet the transition itself may entail potential output losses, particularly if carried out in a disorderly fashion or if certain regions forge ahead while others do not follow fast enough to eliminate global emissions.[36] Climate scenarios generally incorporate a combination of taxes and regulation to increase the effective carbon price. Higher carbon prices encourage households and businesses to switch to alternatives with lower carbon content and promote the innovation, adoption and diffusion of clean technologies. ECB analysis suggests that carbon taxes have so far not had a major adverse impact on potential output in Europe (Box 1).[37]
Box 1
Empirical evidence on the impact of carbon taxes on potential output growth in Europe
The empirical literature on the macroeconomic effects of carbon taxes focuses on the impact on carbon emissions, with few contributions studying the broader macroeconomic implications and even fewer looking into longer-run structural implications. No studies exist on the impact on potential output.
Splitting out endogenous reactions by tax authorities is the key econometric challenge in identifying the dynamic impact of a carbon tax on macroeconomic outcomes. For example, the authorities may react to reductions in potential output by postponing carbon tax increases which, if unaddressed, would lead to biased results. To overcome this challenge, Metcalf and Stock propose splitting carbon tax changes into two components – one predicted by historical economic outcomes as well as current and past international shocks and one unpredicted by those factors, which can then be considered exogenous. The exogenous part can be used to estimate the causal impact of the tax on the economy.[38]
Preliminary research under way at the ECB uses this approach to study the impact of carbon taxes on potential output for 29 European countries over the period from 1985 to 2021.[39] Around half of those countries have enacted carbon taxes, with the highest set by Sweden in 2014 at USD 140/tCO2 (in real terms, based on 2018 purchasing power parity). Chart A shows the impact of a USD 40 carbon tax shock, which is close to the average sample tax rate for those countries that have enacted carbon taxes. Importantly, the lower boundary of the 95% confidence interval is around -0.1 percentage point, implying that the impact is statistically significant above that value. This compares with the average annual growth rate of potential output in the sample of 2.1%. Given the highest tax level in the sample and the fact that carbon taxes have typically risen gradually over time, the results suggest that carbon taxes have not had a major adverse impact on potential output growth in Europe in the past.
Chart A
Impact of a USD 40/tCO2 carbon tax shock on potential output growth
(percentage points)

Sources: AMECO, World Bank and ECB calculations.
Note: The graph shows impact on potential output in the years following the tax shock, with year 0 being the year of implementation.
The green transition is a structural transformation of the economy, shifting capital and workers between sectors, between companies within the same sector and within individual companies. The overall impact therefore depends on a range of structural and technological factors, including barriers that prevent new, innovative firms from entering markets and growing (and inefficient, carbon-intensive ones from leaving), impediments to workers changing positions and the rate of green innovation. If the transition is orderly, with ample technological progress and well-communicated, and hence predictable, carbon price increases and other government policies, carbon-intensive capital can be replaced once depreciated with new, green capital at relatively small extra cost. But if the transition is abrupt, or happens before equivalent green technology exists, carbon-intensive capital becomes obsolete before the end of its usable life, reducing the overall capital stock.
Workers shifting from carbon-intensive jobs to green ones may impair labour supply if there exist substantial skills mismatches, although the balance of evidence suggests few constraints that are unique to the green transition. In around 5% of EU regions, carbon-intensive jobs account for more than 20% of employment.[40] Such regions could suffer from protracted unemployment and skill atrophy, the human equivalent of stranded assets. Yet most “green” jobs are only partly so and share many skills with “dirty” jobs, while most of the unique skills are obtainable through on-the-job training.[41] The International Energy Agency estimates that most carbon-intensive jobs in the energy sector share skills with green energy positions and that more than half of workers in the sector in Europe have already transferred.[42] That said, scarcity of available workers caused by population decline in Europe in the coming decades may slow the green transition.[43] Structural policies that support labour mobility as part of standard economic transformation should therefore also help smooth the impact of the transition on labour supply.
The overall impact of the transition on economy-wide TFP depends on the relative productivity of growing versus shrinking businesses. If shrinking carbon-intensive sectors have greater productivity than growing green sectors, sectoral reallocation during the transition will lead to lower aggregate productivity (and vice versa). The impact may then vary across economies, depending on their industrial structure. But the overall impact is far from certain, since even within sectors there are substantial differences in carbon intensity. The 20% most carbon-intensive EU businesses in the metals and chemicals sectors account for around three-quarters of total sector carbon emissions, but only 20-30% of employment. In the cement and lime sector, where businesses use similar technology, the 20% most emissions-intensive firms account for 30% of emissions, but only 10% of employment.[44] The most emissions-intensive businesses generally have lower TFP than other firms in the same sector, so reallocating their output and labour could both boost sectoral TFP and reduce emissions.[45]
The overall long-run impact on productivity ultimately depends on successful innovation in green technologies that can match carbon-intensive ones for efficiency. Care needs to be taken when comparing these technologies – the inefficiency of long-run environmental degradation of current carbon-intensive technologies is not currently well-measured. Green technologies that avoid this damage, including capital put in place to abate emissions, may not have their full contribution measured in GDP, and so may falsely appear less efficient than existing technology.
Environmental regulation may encourage innovation that enhances productivity sufficiently over the long run to offset the short-run costs (the Porter hypothesis).[46] Evidence for the hypothesis is mixed overall, but one key sector where green innovation has resulted in competitive technology is electricity generation. Technological improvements and economies of scale have caused the price of electricity generated from wind and solar to plummet over the past decade. Both sources are now markedly cheaper than fossil fuel sources of electricity on a levelised cost basis.[47] While challenges remain to handle intermittency, particularly at high penetration rates, a substantial switch from fossil fuel electricity generation to renewables would at present likely result in both lower carbon intensity and lower costs. Since the euro area is a net importer of fossil fuels, reduced reliance would also reduce the impact of supply shocks arising from this energy source.
The impact of regulation varies across businesses, with those at the technological frontier better able to reap benefits.[48] ECB research has highlighted how different policies used to incentivise decarbonisation vary in their impact on firm-level productivity. Market-based policies (such as carbon taxes) and subsidies for research and development have the lowest negative overall impact, whereas regulation has a more marked negative impact (Box 2). Larger firms are less affected by transition policies, reflecting both better access to capital and a greater innovative capacity.
Box 2
Testing the Porter hypothesis: environmental regulation and productivity growth in the euro area
The Porter hypothesis states that environmental regulation might trigger innovation and productivity gains over the long run that compensate possible short-term costs. Empirical testing of the hypothesis is inconclusive. Moreover, using country-level data and aggregate policy measures hides the heterogenous effects of various policies on different types of firms.
Recent ECB research uses data for more than three million individual firms from six euro area countries from 2003 to 2019 along with the OECD’s Environmental Stringency Policy (EPS) indicator to test the Porter hypothesis.[49] The research uses estimates of firm-level carbon emissions to identify the causality of the impacts, given that environmental policy is likely to affect firms differently depending on their exposure to the regulation. The research aims to determine how firm-level innovation and TFP growth are affected over time by tighter environmental regulation. It also differentiates between types of environmental policy, splitting them up into market-based measures (such as carbon taxes and emissions trading schemes), non-market-based measures (such as bans or limits on certain products or processes) and technology support for green research and development (R&D).
More stringent environmental policy affects emission-intensive firms more than their low-emission peers. It is, however, important to distinguish between the different policy types. For high-emission firms, R&D support policies only have temporary negative effects before eventually boosting TFP growth. By contrast, market policies have persistent negative, albeit small effects, and non-market tools reduce TFP growth the strongest in the five years following the policy change (Chart A). But high-emission firms are not all affected in the same way. The TFP growth of large emission-intensive firms increases after a policy change, while that of small emission-intensive firms falls significantly, which could reflect better access to capital and higher innovative capacity.
Chart A
Firm-level impulse response functions of a tightening of environmental policy on TFP growth of high-emission firms
(percentage points)
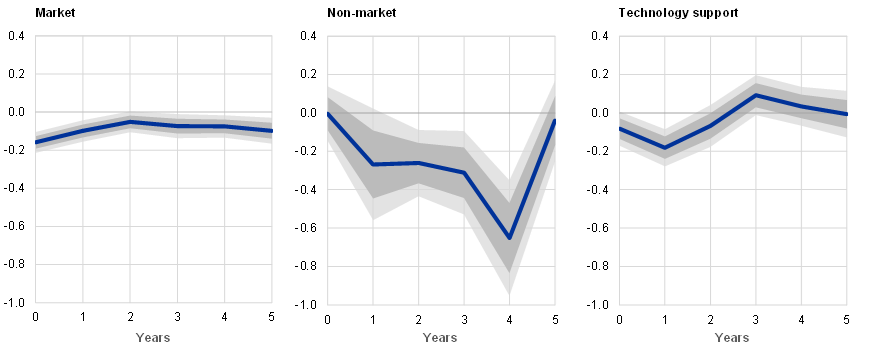
Source: ECB calculations.
Notes: Impulse response function of a 1 percentage point EPS change on a firm’s TFP growth over five years for market (taxes), non-market (emission limits) and technology support (R&D subsidies) policies. High-emission firms are identified as those in the top half of the carbon emission distribution. Shaded areas show the 68% and 90% confidence intervals.
We also study the impact on patent applications to check whether more stringent policies may increase long-run TFP growth by spurring innovation and investment in green technology and whether green innovation crowds out other innovation.[50] Green patent applications by high-emission firms increase significantly after the tightening of environmental policies, without crowding out other types of innovation (Chart B). The positive impact is driven by non-market and, above all, R&D support policies. Market-based policies barely affect patenting by firms. However, looking at just the largest 25% of policy changes, market-based policies do have a significant and positive impact on green innovation. There is no evidence of crowding out, as other patent applications either do not change or even increase slightly. This increase could be due to complementarities across technology types if, for example, a new green technology also requires new software.
Chart B
Firm-level impulse response functions of a tightening of environmental policy on green patent applications by high-emission firms
(percentage points)
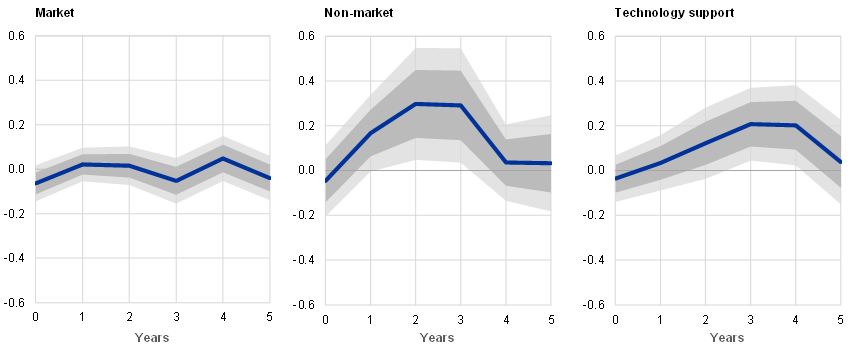
Source: ECB calculations.
Notes: Impulse response function of a 1 percentage point EPS change on an increase in a firm’s green patent applications over five years for market (taxes), non-market (emission limits) and technology support (R&D subsidies) policies. High-emission firms are identified as those in the top half of the carbon emission distribution.
The overall combined results provide some support for the Porter hypothesis – while firm-level TFP growth declines following a tightening of environmental policy, it can increase over the long term as patent applications increase.
6 Other climate-related factors influencing potential output
Potential output may also be affected in the short or long run by other climate-related factors, most notably intermediate inputs to production. Many green technologies rely on certain critical metals and minerals, such as lithium, cobalt and silicon, which will need to be mined in much greater quantities than at present. Future supply chain disruptions affecting these raw materials may temporarily restrict the production of solar panels, wind turbines, electric vehicles and other key transition products.[51]
A large share of economic activity relies on the – unpriced and unvalued – contribution of natural capital, biodiversity and ecosystem services. Clean air, clean water and wild pollination are just some of these services that do not appear in GDP. Yet the environmental degradation witnessed over recent decades could threaten their contribution to potential output in the future. Box 3 explores the reliance of European businesses on these ecosystem services.
Box 3
Economic activity’s reliance on nature
Human wellbeing relies on nature and biodiversity – the variety and variability of life on Earth. We all require the food, clean air and water, energy and raw materials provided by nature. The economy is no different, with over half of global economic production dependent on nature and the ecosystem services it provides.[52] Pollination, for example, is required by about 75% of our food crops,[53] with an estimated annual global economic value of between €248 billion and €293 billion.[54]
Despite mounting scientific evidence of nature’s high socio-economic benefit, natural ecosystems are deteriorating at an unprecedented rate. An estimated 1-in-8 animal and plant species on Earth are threatened by extinction, with the number as high as 1-in-4 in Europe.[55] The main drivers of biodiversity loss include land use, climate change, overexploitation of natural resources, pollution and invasive species. The estimated annual global cost is already immense: around €3.5-18.5 trillion in reduced ecosystem services and €5.5-10.5 trillion from land degradation.[56]
Nature loss affects the economy through three main channels, similar to the climate change channels discussed above: increased impact of extreme weather and climate events, long-run dwindling of ecosystems and the impact of policies put in place to avert these losses. For example, wetland loss increases vulnerability to storm surges,[57] fewer pollinators reduce agricultural output, and regulation could limit the exploitation of natural resources or ban certain products. Some business models may disappear, while others might become too expensive and lose market share. Shaping effective policy measures requires an understanding of double materiality: how the economy affects nature and how nature affects the economy.
Our analysis shows that around three-quarters of non-financial corporations in the euro area are highly dependent on natural benefits such as protection from floods and storms, freshwater provision and climate regulation (including carbon removal).[58] Severe impairment of the relevant ecosystem would create critical economic problems for those companies. Similarly, around three-quarters of euro area corporate bank loans are granted to companies highly dependent on at least one ecosystem service, which could lead to substantial bank losses in the event of critical ecosystem failure, amplifying the overall economic impact.
Climate change and nature loss are closely interconnected. Identifying the interdependencies and reinforcing mechanisms between climate, environmental pressures and biodiversity is crucial to fully capture nature-related risks. Timely recognition, assessment and action to address these challenges are essential to mitigate future economic losses. While further development of risk modelling frameworks is needed to identify and quantify the key transmission channels, we already have enough data and knowledge available to enable nature-friendly policymaking while there is still time.
Chart A
Direct and indirect dependency of euro area non-financial corporations on ecosystem services
(dependency scores)
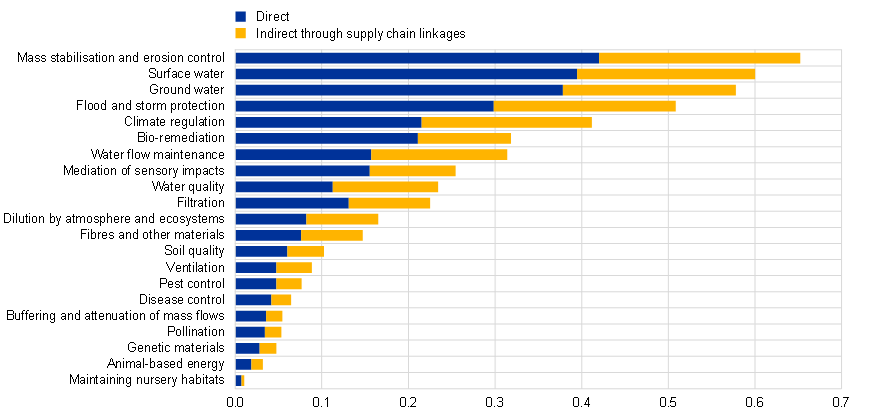
Sources: ENCORE, EXIOBASE, AnaCredit and ECB calculations.
Notes: Euro area dependency score is computed as the average of the dependency scores of euro area non-financial corporations. A distinction is made between direct dependency (Scope 1) and indirect dependency (upstream) associated with the supply chain.
7 Conclusions
Climate change and actions taken to tackle it are likely to affect potential output in the euro area in the coming decades. The impacts extend beyond the destruction of physical capital during extreme events and include the impacts on labour supply and technological progress. For many of the channels described here, our knowledge remains imperfect and would benefit greatly from future research. The effects of biodiversity loss in particular have received little attention so far.
One major challenge for monetary policy is the substantial localised impact of climate change on regions or on certain sectors, in contrast to standard macroeconomic shocks. Divergent country-level impacts in particular can pose challenges for the operation of monetary policy in the euro area. Recent research has highlighted how production linkages between firms can amplify shocks.[59] Climate change impacts concentrated on certain sectors or regions may therefore affect aggregate activity and prices by much more than their share in output would suggest and hence have repercussions for monetary policy.
Finally, the range of the channels of impact and the number of obstacles to a successful green transition highlight the need for a broad range of policies to complement carbon pricing. The transition is a structural transformation of the economy. Structural policies that support effective movements of capital and labour across activities are vital, as are those that support innovation and the widespread uptake of new technologies. At the same time, even with a swift and smooth transition, the impacts of climate change and extreme events are likely to increase, requiring adaptation measures including irrigation, air conditioning and insurance.
See Intergovernmental Panel on Climate Change, “Climate Change 2022: Impacts, Adaptation and Vulnerability, Summary for Policymakers”, Cambridge University Press, Cambridge and New York, 2022.
See, for example, Network for Greening the Financial System, “NGFS Scenarios for central banks and supervisors”, September 2022.
Preliminary analysis by the European System of Central Banks’ Expert Group on Productivity finds that labour productivity in the euro area would be 0.5 percentage points lower in a disorderly transition scenario relative to an orderly one.
See the article entitled “Potential output in the post-crisis period”, Economic Bulletin, Issue 7, ECB, 2018.
See Panetta, F., “The complexity of monetary policy”, speech, Florence, 14 November 2022.
See Amelung, B. and Moreno, A., “Impacts of climate change in tourism in Europe. PESETA-Tourism study”, JRC Scientific and Technical Reports, EUR 24114 EN, Luxembourg, 2009.
See Jacobs, C. et al., “Climate change adaptation in the agriculture sector in Europe”, European Environmental Agency Report, No 04, 2019; Ceglar, A. et al., “Observed Northward Migration of Agro-Climate Zones in Europe Will Further Accelerate Under Climate Change”, Earth’s Future, Vol. 7, Issue 9, 2019, pp. 1088-1101.
See Heal, G. and Park, J., “Temperature Stress and the Direct Impact of Climate Change: A Review of an Emerging Literature”, Review of Environmental Economics and Policy, Vol. 10, No 2, 2016, pp. 1-17.
See Graff Zivin, J., and Neidell, M., “Temperature and the Allocation of Time: Implications for Climate Change”, Journal of Labor Economics, Vol. 32, No 1, 2014, pp. 1-26.
See Graff Zivin, J., Hsiang, S. and Neidell, M., “Temperature and Human Capital in the Short and Long Run”, Journal of the Association of Environmental and Resource Economists, Vol. 5, No 1, 2018, pp. 77-105.
See Dell, M., Jones, B. and Olken, B., “Temperature Shocks and Economic Growth: Evidence from the Last Half Century”, American Economic Journal: Macroeconomics, Vol. 4, No 3, 2012, pp. 66-95.
See Deutsche Bundesbank, “Climate change and climate policy: analytical requirements and options from a central bank perspective”, Monthly Report, January 2022, pp. 33-61.
See Ballester, J. et al., “Heat-related mortality in Europe during the summer of 2022”, Nature Medicine, Vol. 29, 10 July 2023, pp. 1857-1866.
See Barreca, A. et al., “Adapting to Climate Change: The Remarkable Decline in the US Temperature-Mortality Relationship over the Twentieth Century”, Journal of Political Economy, Vol. 124, No 1, 2016, pp. 105-159.
ibid.
See Mora, C. et al., “Over half of known human pathogenic diseases can be aggravated by climate change”, Nature Climate Change, Vol. 12, 2022, pp. 869-875.
See Missirian, A. and Schlenker, W., “Asylum applications respond to temperature fluctuations”, Science, Vol. 358, Issue 6370, 2017, pp. 1610-1614.
See Burzyński, M. et al., “Climate Change, Inequality, and Human Migration”, Journal of the European Economic Association, Vol. 20, Issue 3, 2022, pp. 1145-1197.
See Noy, I., “The macroeconomic consequences of disasters,” Journal of Development Economics, Vol. 88, Issue 2, 2009, pp. 221-231.
See McDermott, T., Barry, F. and Tol, R., “Disasters and development: natural disasters, credit constraints, and economic growth,” Oxford Economic Papers, Vol. 66, Issue 3, 2014, pp. 750-773; Fache Rousová, L. et al., “Climate change, catastrophes and the macroeconomic benefits of insurance”, Financial Stability Review, European Insurance and Occupational Pensions Authority, July 2021.
See Skidmore, M. and Toya, H., “Do Natural Disasters Promote Long-Run Growth?”, Economic Inquiry, Vol. 40, Issue 4, 2002, pp. 664-687.
See Cuaresma, J., Hlouskova, J. and Obersteiner, M., “Natural disasters as creative destruction? Evidence from developing countries”, Economic Inquiry, Vol. 46, Issue 2, 2008, pp. 214-226.
See Hallegatte, S. and Dumas, P., “Can natural disasters have positive consequences? Investigating the role of embodied technical change,” Ecological Economics, Vol. 68, Issue 3, 2009, pp. 777-786.
See Poontirakul, P. et al., “Insurance as a Double-Edged Sword: Quantitative Evidence from the 2011 Christchurch Earthquake”, The Geneva Papers on Risk and Insurance – Issues and Practice, Vol. 42, 2017, pp. 609-632.
See Basker, E. and Miranda, J., “Taken by storm: business financing and survival in the aftermath of Hurricane Katrina”, Journal of Economic Geography, Vol. 18, Issue 6, 2018, pp. 1285-1313; Uchida, H. et al., “Financial shocks, bankruptcy, and natural selection,” Japan and the World Economy, Vol. 36, 2015, pp. 123-135.
See Bier, V., “Understanding and Mitigating the Impacts of Massive Relocations Due to Disasters”, Economics of Disasters and Climate Change, Vol. 1, Issue 2, 2017, pp. 179-202.
See Vigdor, J., “The Economic Aftermath of Hurricane Katrina”, Journal of Economic Perspectives, Vol. 22, No 4, 2008, pp. 135-154.
See Hornbeck R., “The Enduring Impact of the American Dust Bowl: Short- and Long-Run Adjustments to Environmental Catastrophe”, American Economic Review, Vol. 102, No 4, 2012, pp. 1477-1507.
See Deryugina, T., Kawano, L. and Levitt, S., “The Economic Impact of Hurricane Katrina on Its Victims: Evidence from Individual Tax Returns”, American Economic Journal: Applied Economics, Vol. 10, No 2, 2018, pp. 202-33.
See Almond, D., “Is the 1918 Influenza Pandemic Over? Long-Term Effects of In Utero Influenza Exposure in the Post-1940 U.S. Population,” Journal of Political Economy, Vol. 114, No 4, 2006, pp. 672-712; Caruso, G. and Miller, S., “Long run effects and intergenerational transmission of natural disasters: A case study on the 1970 Ancash Earthquake”, Journal of Development Economics, Vol. 117, 2015, pp. 134-150.
See Leiter, A., Oberhofer, H. and Raschky, P., “Creative Disasters? Flooding Effects on Capital, Labour and Productivity Within European Firms”, Environmental & Resource Economics, Vol. 43, No 3, 2009, pp. 333-350.
See Noy, I. and Strobl, E., “Creatively Destructive Hurricanes: Do Disasters Spark Innovation?”, Environmental and Resource Economics, Vol. 84, 2023, pp. 1-17.
See, for example, Isoré, M. and Szczerbowicz, U., “Disaster risk and preference shifts in a New Keynesian model”, Journal of Economic Dynamics and Control, Vol. 79, Issue C, 2017, pp. 97-125; Dietrich, A., Müller, G. and Schoenle, R., “The Expectations Channel of Climate Change: Implications for Monetary Policy”, CEPR Discussion Papers, No 15866, Centre for Economic Policy Research, 2021.
See Cantelmo, A., “Rare Disasters, the Natural Interest Rate and Monetary Policy”, Oxford Bulletin of Economics and Statistics, Vol. 84, Issue 3, 2022, pp. 473-496.
See Network for Greening the Financial System, op. cit.
It is also important to use the correct comparison to evaluate potential output losses. The true benchmark for transition impacts is not the past, but a future with unmitigated climate change.
The implications of carbon taxes extend beyond potential output. For a discussion of euro area fiscal impacts, see the article entitled “Fiscal policies to mitigate climate change in the euro area”, Economic Bulletin, Issue 6, ECB, 2022.
See Metcalf, G. and Stock, J., “Measuring the Macroeconomic Impact of Carbon Taxes”, AEA Papers and Proceedings, Vol. 110, 2020, pp. 101-106.
The results presented follow this empirical approach. They are based on the full sample and are shown for two-year lag local projections. The sample comprises only countries that are covered by the EU Emissions Trading System, and hence controls for its impact.
See Vandeplas, A. et al., “The Possible Implications of the Green Transition for the EU Labour Market”, European Economy Discussion Papers, No 176, European Commission, 2022. Based on NUTS 2 basic regions.
See Bowen, A., Kuralbayeva, K. and Tipoe, E., “Characterising green employment: The impacts of ‘greening’ on workforce composition”, Energy Economics, Vol. 72, 2018, pp. 263-275.
See International Energy Agency, World Energy Employment, 2022.
See the box entitled “EUROPOP2023 demographic trends and their euro area economic implications”, Economic Bulletin, Issue 3, ECB, 2023.
See Bijnens, G. and Swartenbroekx, C., “Carbon emissions and the untapped potential of reallocation – Lessons from the EU ETS”, NBB Economic Review, No 06, 2022.
ibid.
See Porter, M. and van der Linde, C., “Toward a new conception of the environment-competitiveness relationship”, Journal of Economic Perspectives, Vol. 9, No 4, 1995, pp. 97-118.
The net present cost per kWh of electricity generated over the lifetime of a plant, including financing, building and operating.
See OECD, “Productivity growth, environmental policies and the Porter hypothesis”, Assessing the economic impacts of environmental policies: Evidence from a decade of OECD research, Organisation of Economic Co-operation and Development, Paris, 2021.
See Benatti, N., Groiss, M., Kelly, P. and Lopez-Garcia, P., “Environmental regulation and productivity growth in the euro area: testing the Porter hypothesis”, Working Paper Series, No 2820, ECB, 2023.
Benatti, N., Groiss, M., Kelly, P. and Lopez-Garcia, P., “Environmental regulation and innovation in the euro area: Testing the Porter hypothesis”, Working Paper Series, ECB, forthcoming.
For an analysis of the impact of supply chain disruptions on euro area potential output, see the box entitled “How persistent supply chain disruptions could affect euro area potential output”, Economic Bulletin, Issue 1, ECB, 2022.
See World Economic Forum, “Nature Risk Rising: Why the Crisis Engulfing Nature Matters for Business and the Economy”, 2020.
See Klein, A.-M. et al., “Importance of pollinators in changing landscapes for world crops”, Proceedings of the Royal Society B, Vol. 274, Issue 1608, 2007.
See Intergovernmental Science-Policy Platform on Biodiversity and Ecosystem Services, “Assessment report on pollinators, pollination and food production”, Bonn, 2016.
See Intergovernmental Science-Policy Platform on Biodiversity and Ecosystem Services, “Summary for policymakers of the global assessment report on biodiversity and ecosystem services”, Bonn, 2019.
See Costanza, R. et al., “Changes in the global value of ecosystem services”, Global Environmental Change, Vol. 26, 2014, pp. 152-158.
See Narayan, S. et al., “The Value of Coastal Wetlands for Flood Damage Reduction in the Northeastern USA”, Scientific Reports, Vol. 7, No 9463, 2017.
See Elderson, F., “The economy and banks need nature to survive”, The ECB Blog, 8 June 2023.
See, for example, Baqaee, D. and Farhi, E., “The Macroeconomic Impact of Microeconomic Shocks: Beyond Hulten’s Theorem”, Econometrica, Vol. 87, Issue 4, 2019, pp. 1155-1203; Guerrieri, V. et al., “Macroeconomic Implications of COVID-19: Can Negative Supply Shocks Cause Demand Shortages?”, American Economic Review, Vol. 112, No 5, 2022, pp. 1437-1474.