
- STATISTICAL RELEASE
Euro area economic and financial developments by institutional sector: fourth quarter of 2023
26 April 2024
- As of April 2024, ECB quarterly financial accounts provide new details on household holdings of investment fund shares/units broken down by underlying asset and counterpart sector. Notably, household exposure to rest of world assets is primarily through indirect holdings via investment fund shares
- Euro area net saving increased to €833 billion in four quarters to fourth quarter of 2023, compared with €751 billion one quarter earlier
- Household debt-to-income ratio decreased to 87.0% in fourth quarter of 2023 from 92.8% one year earlier
- Non-financial corporations' debt-to-GDP ratio (consolidated measure) decreased to 67.1% in fourth quarter of 2023 from 71.6% one year earlier
New details on household assets
The ECB is from now on releasing more detailed data on household holdings of investment fund shares/units broken down by underlying asset and by counterpart sector, thereby providing further insights into households‘ indirect exposures.[1] Investment funds allow investors to gain exposure to a large number and variety of assets without buying them directly. Investment fund holdings amount to about one tenth of the total financial assets held by euro area households and are the fourth largest asset class after deposits, unlisted shares (for example, ownership in private businesses), and insurance and pension savings.
These new experimental data on households’ indirect exposures can be used to more accurately analyse the financial balance sheet of households and their exposure to different asset classes and counterpart sectors. The methodology and calculations have been prepared in close collaboration with euro area national central banks. The data are derived from several datasets available at the ECB: securities holding statistics by sector, investment fund statistics, and financial accounts data.
Households prefer indirect over direct exposures especially for assets issued by the rest of the world (i.e. where the issuers/debtors do not reside in the euro area), with the share of rest of the world in total assets increasing from 2% before the look-through to 9% afterwards (see Chart 1, which shows selected financial assets directly held by households vis-à-vis counterpart sectors in 2023 Q4, and the resulting breakdown by counterpart sectors after looking-through investment funds). Considering the financial instrument breakdown, the look-through leads to higher estimates especially for the households’ exposures to listed shares (from 5% to 9% of households’ assets) and debt securities (from 3% to 7%). For more details see the note on looking-through households’ investment in investment fund shares in the quarterly financial accounts.
Chart 1
Households’ financial assets by counterpart sector; selected financial instruments*
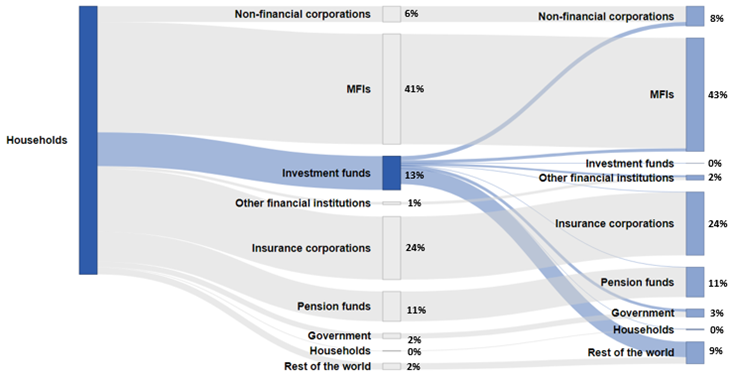
Source: ECB.
Notes: Discrepancies between totals and their components may arise from rounding.
This chart refers to financial instruments for which the counterpart sector breakdown is available: deposits, loans, debt securities, listed shares and investment fund shares/units. In addition, the counterpart sector breakdown for insurance, pension and standardised guarantee schemes (F.6) is an estimate. (See the methodological note on the ECB’s website: Extension of the who-to-whom presentation to insurance and pension assets).
Total euro area economy
Euro area net saving increased to €833 billion (7.3% of euro area net disposable income) in 2023 compared with €751 billion in the four-quarter period ending in the third quarter of 2023. Euro area net non-financial investment increased to €605 billion (5.3% of net disposable income), mainly due to increased net investment by non-financial corporations and government, while net investment of households was broadly unchanged (see Chart 2).
Euro area net lending to the rest of the world increased to €281 billion (from €200 billion in the previous quarter) reflecting net saving increasing more than non-financial investment. Net lending of households grew to €457 billion (4.0% of net disposable income) from €393 billion. Net lending of non-financial corporations decreased to €220 billion (1.9% of net disposable income) from €236 billion, and that of financial corporations decreased to €120 billion (1.0% of net disposable income) from €125 billion. Net borrowing by general government decreased, contributing thus less negatively (-€516 billion or ‑4.5% of net disposable income, after -€554 billion) to euro area net lending.
Chart 2
Euro area saving, investment and net lending to the rest of the world
(EUR billions, four-quarter sums)

* Net saving minus net capital transfers to the rest of the world (equals change in net worth due to transactions).
Financial transactions can be presented with a counterpart sector breakdown for deposits, loans, debt securities, listed shares and investment fund shares (see Table 1). In 2023 the largest aggregated transactions in these financial instruments were interbank operations as other MFIs[2] redeemed liabilities with the Eurosystem (-€947 billion), decreased deposits with the Eurosystem (-€488 billion) and increased deposits and other assets with other MFIs (€693 billion). Financial investment of households involved to a large extent transactions vis-à-vis other MFIs (€192 billion), mostly in the form of deposits, as well as the financing of government through purchases of debt securities (€187 billion). Non-financial corporations’ largest financing component (€90 billion) was from within the NFC sector, mostly in the form of loans and listed shares, while financing from other MFIs amounted to €56 billion. The largest financial transactions vis-à-vis the rest of the world were other MFIs’ financial investments (€345 billion).
Table 1
Selected financial transactions* between sectors and with the rest of the world
(EUR billions, four-quarter sums, 2023)

Source: ECB.
* Financial instruments for which the counterpart sector breakdown is available: deposits, loans, debt securities, listed shares and investment fund shares/units.
Households
Household financial investment increased at a broadly unchanged annual rate of 2.1% in the fourth quarter of 2023. Among its components, currency and deposits (0.9% after 0.5%) and debt securities (61.6% after 59.8%) grew at higher rates. This acceleration was mostly offset by slower growth of investments in shares and other equity (0.2% after 1.0%) and life insurance (-0.4% after 0.2%), while pension schemes grew at an unchanged rate (2.6%).
Households increased investment in debt securities was again driven by net purchases of debt securities issued by general government, MFIs and other financial institutions. Households were overall net sellers of listed shares, due to net sales of listed shares of non-financial corporations, while they purchased listed shares of all other sectors and the rest of the world (i.e. shares issued by non-euro area residents), (see Table 2 below and Table 2.2. in the Annex).
The household debt-to-income ratio[3] decreased to 87.0% in the fourth quarter of 2023 from 92.8% in the fourth quarter of 2022. The household debt-to-GDP ratio also decreased, to 53.6% in the fourth quarter of 2023 from 56.7% in the fourth quarter of 2022 (see Chart 3).
Table 2
Financial investment and financing of households, main items
(annual growth rates)
Financial transactions | |||||
2022 Q4 | 2023 Q1 | 2023 Q2 | 2023 Q3 | 2023 Q4 | |
Financial investment* | 2.4 | 2.3 | 2.2 | 2.0 | 2.1 |
Currency and deposits | 3.8 | 2.3 | 1.6 | 0.5 | 0.9 |
Debt securities | 15.7 | 39.3 | 49.7 | 59.8 | 61.6 |
Shares and other equity** | 1.2 | 1.4 | 1.0 | 1.0 | 0.2 |
Life insurance | 0.8 | 0.8 | 0.7 | 0.2 | -0.4 |
Pension schemes | 2.5 | 2.4 | 2.4 | 2.6 | 2.6 |
Financing*** | 4.4 | 3.7 | 2.3 | 1.6 | 1.3 |
Loans | 3.7 | 2.9 | 1.8 | 1.0 | 0.6 |
Source: ECB.
* Items not shown include: loans granted, prepayments of insurance premiums and reserves for outstanding claims and other accounts receivable.
** Includes investment fund shares.
*** Items not shown include: financial derivatives' net liabilities, pension schemes and other accounts payable.
Chart 3
Debt ratios of households and non-financial corporations
(percentages of GDP)

Source: ECB and Eurostat.
* Outstanding amount of loans, debt securities, trade credits and pension scheme liabilities.
** Outstanding amount of loans and debt securities, excluding debt positions between non-financial corporations.
*** Outstanding amount of loan liabilities.
Non-financial corporations
Financing of non-financial corporations increased at an annual rate of 0.7% in the fourth quarter of 2023, after 0.5% in the previous quarter. This higher growth resulted mainly from an acceleration in financing by loans (1.1% after 0.8%), driven by loans from other financial institutions, and trade credits (0.9% after 0.0%). Financing by the issuance of shares and other equity grew at an unchanged rate (0.2%), while the growth rate of debt securities issuance decreased (1.7% after 1.9%, see Table 3 below and Table 3.2 in the Annex).
Table 3
Financing and financial investment of non-financial corporations, main items
(annual growth rates)
Financial transactions | |||||
2022 Q4 | 2023 Q1 | 2023 Q2 | 2023 Q3 | 2023 Q4 | |
Financing* | 2.2 | 1.6 | 0.9 | 0.5 | 0.7 |
Debt securities | 1.2 | 0.2 | 0.9 | 1.9 | 1.7 |
Loans | 4.7 | 3.6 | 2.6 | 0.8 | 1.1 |
Shares and other equity | 0.8 | 0.5 | -0.1 | 0.2 | 0.2 |
Trade credits and advances | 6.7 | 5.0 | 2.0 | 0.0 | 0.9 |
Financial investment** | 3.4 | 2.8 | 1.8 | 1.4 | 1.5 |
Currency and deposits | 5.1 | 0.9 | -1.3 | -2.0 | -1.6 |
Debt securities | 14.9 | 24.4 | 23.1 | 26.4 | 22.7 |
Loans | 4.6 | 3.9 | 3.0 | 2.3 | 3.9 |
Shares and other equity | 1.5 | 1.1 | 0.6 | 1.1 | 1.0 |
Source: ECB.
* Items not shown include: pension schemes, other accounts payable, financial derivatives’ net liabilities and deposits.
** Items not shown include: other accounts receivable and prepayments of insurance premiums and reserves for outstanding claims.
Non-financial corporations' debt-to-GDP ratio (consolidated measure) decreased to 67.1% in the fourth quarter of 2023, from 71.6% in the fourth quarter of 2022; the non-consolidated, wider debt measure declined to 126.2% from 133.4% (see Chart 3).
Chart 4 below shows the main components of the non-financial corporations’ debt (in dark blue) vis-à-vis counterpart sectors. At the end of 2023, the non-financial corporations’ debt in the form of loans and debt securities was held primarily by MFIs (37%), other non-financial corporations (29%), the rest of the world (13%) and other financial institutions (11%).
Chart 4
The main components of NFC debt (loans and debt securities) by counterpart sector
(2023 end of period stocks)

Source: ECB.
Discrepancies between totals and their components may arise from rounding.
For queries, please use the Statistical information request form.
Notes
- These data come from a second release of quarterly euro area sector accounts from the European Central Bank (ECB) and Eurostat, the statistical office of the European Union. This release incorporates revisions and completed data for all sectors compared with the first quarterly release on "Euro area households and non-financial corporations" of 9 April 2024.
- The euro area and national financial accounts data of non-financial corporations and households are available in an interactive dashboard.
- The debt-to-GDP (or debt-to-income) ratios are calculated as the outstanding amount of debt in the reference quarter divided by the sum of GDP (or income) in the four quarters to the reference quarter. The ratio of non-financial transactions (e.g. savings) as a percentage of income or GDP is calculated as sum of the four quarters to the reference quarter for both numerator and denominator.
- The annual growth rate of non-financial transactions and of outstanding assets and liabilities (stocks) is calculated as the percentage change between the value for a given quarter and that value recorded four quarters earlier. The annual growth rates used for financial transactions refer to the total value of transactions during the year in relation to the outstanding stock a year before.
- Hyperlinks in the main body of the statistical release lead to data that may change with subsequent releases as a result of revisions. Figures shown in annex tables are a snapshot of the data as at the time of the current release.
- The ECB published on 8 January 2024 the first experimental Distributional Wealth Accounts (DWA) for the household sector. The release of results for 2023 Q4 is planned for end-May 2024.
This is referred to as looking-through investment fund shares. For brevity the term investment fund shares is used for non-money market funds investment fund shares/units.
Other MFIs include banks and money market funds but exclude the Eurosystem.
Calculated as loans divided by gross disposable income adjusted for the change in pension entitlements.