
- SPEECH
Prospects for inflation: sneezes and breezes
Welcome address by Isabel Schnabel, Member of the Executive Board of the ECB, at the ECB and Federal Reserve Bank of Cleveland’s “Inflation: Drivers and Dynamics Conference 2021”
Frankfurt am Main, 7 October 2021
Introduction
Euro area headline inflation is expected to have reached 3.4% in September according to the most recent flash estimate, its highest annual rate in more than a decade and notably above the ECB’s new symmetric target of 2% to be attained over the medium term.[1]
The recent rise in inflation, which was at least partly expected, has intensified the debate about the most likely future evolution of price pressures – in the euro area and elsewhere. It stands in sharp contrast to the developments observed over the past decade when structural headwinds prevented inflation from converging towards our target. The timing of this conference on inflation drivers and dynamics could therefore hardly be more fitting.
I will begin my remarks by briefly discussing how the current spike in inflation can in large part be attributed to temporary pandemic-related factors that are likely to dissipate in the medium term. Then I will turn to a more thorough discussion of the headwinds and tailwinds that may contribute to the evolution of inflation over the medium term, linking them to research that will be presented at this conference. My main focus will be on two important topics: inflation expectations and behavioural changes, for example regarding firms’ price setting behaviour.
We devoted a substantial part of our recently concluded strategy review to understanding how these factors affect inflation dynamics, and continue to pursue an ambitious research agenda in these areas.[2] Opportunities such as this conference provide a welcome platform to interact with the academic community and thereby advance our thinking on these topics. The papers that will be presented at this conference address many questions that are highly relevant in the current debate on inflation and therefore have important ramifications for the future conduct of monetary policy.
Near-term prospects: an inflation sneeze
Let me begin by recalling the evolution of price dynamics in the euro area over the ten years that have passed since inflation last reached levels around 3%.
Over most of the past decade, inflation has persistently fallen short of the ECB’s previous inflation aim of below, but close to, 2 percent. Both headline and core inflation averaged around 1% between January 2013 and December 2019 (Chart 1).
Chart 1
Euro area headline and core HICP inflation
(annual percentage changes)
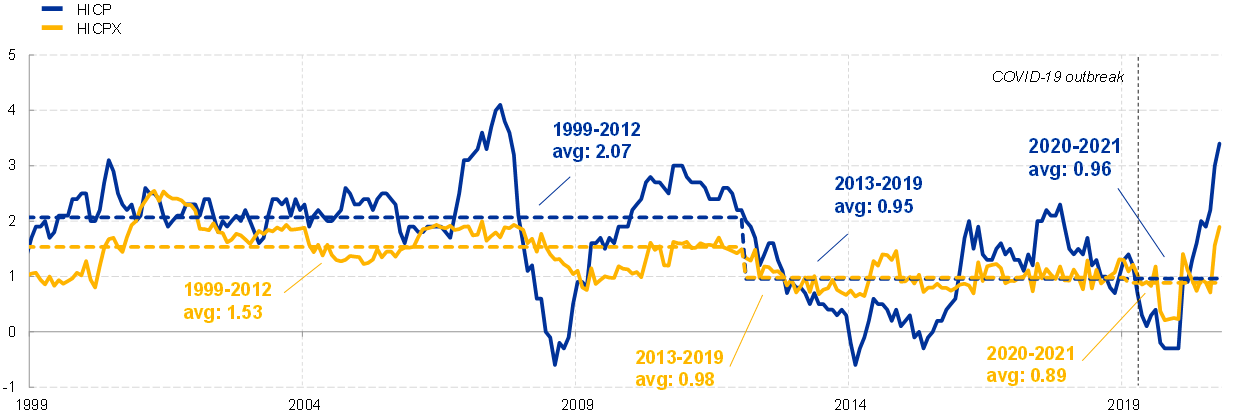
Source: Eurostat and ECB calculations.
Latest observation: September 2021 (flash estimate).
Moreover, inflation repeatedly surprised on the downside relative to our in-house staff projections before the pandemic (Chart 2). Other international institutions and financial market participants also continuously overpredicted future inflation developments.
Chart 2
Eurosystem headline annual inflation projections over time
(annual percentage changes)
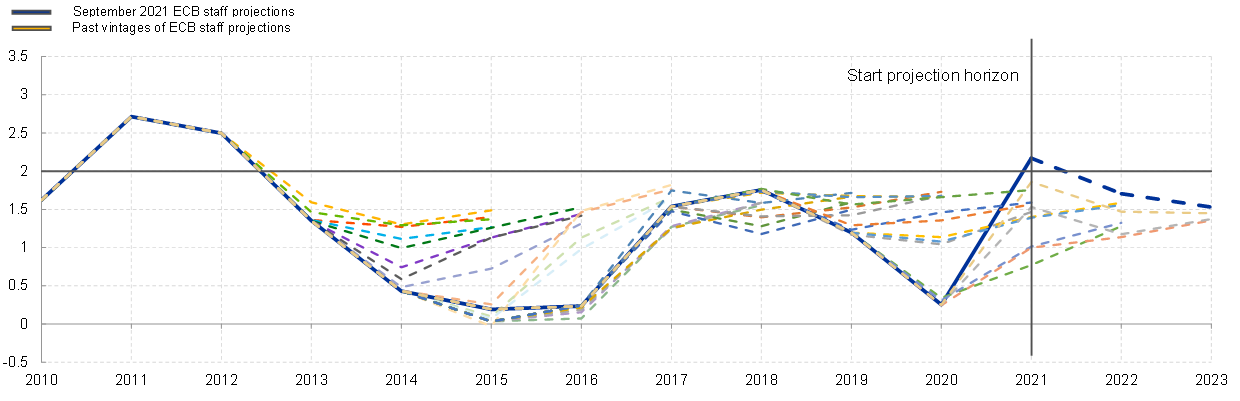
Source: ECB.
Note: The chart is based on annual inflation data.
Latest observation: August 2021, September 2021 Macroeconomic Projections.
Subdued inflation dynamics were driven by both cyclical and structural factors, which, in combination, created sustained headwinds for underlying price pressures. A high level of slack after the double-dip recession, diminishing conventional monetary policy space in the vicinity of the effective lower bound as well as structural factors, such as globalisation, digitalisation and demographic change, have all contributed to persistently low inflation rates. During our monetary policy strategy review, we conducted detailed analysis to examine the relative importance of these drivers.[3]
The pandemic has added a whirlwind of short-term disruptions on top of these long-term trends. Initially, the pandemic had put further downward pressure on inflation in the euro area. Inflation declined substantially in 2020, with rates temporarily entering negative territory in the second half of the year. Much of that decline was attributable to specific pandemic-related, temporary factors, including a substantial decline in commodity prices and the temporary cut in German VAT rates.
With the onset of the recovery, inflation picked up rapidly. In fact, the current spike in inflation owes much to the continued impact of those same factors that pushed down inflation earlier in the annual comparison. Consequently, their impact on inflation rates will be transitory.[4] Indeed, more than half of measured headline inflation in the euro area, based on the harmonised index of consumer prices (HICP), is currently due to rising energy prices and the reversal of the German VAT cut (Chart 3).
Inflation has also been affected by changes in the weights in the consumption basket. Consumption patterns changed markedly last year owing to the impact of lockdowns, leading to a shift in consumption weights that are used to calculate Eurostat’s inflation index.
These changing weights can have a notable impact on the measurement of inflation: HICP inflation would have been even higher in recent months using last year’s weights (Chart 3). For example, assuming constant consumption weights, euro area services inflation would have amounted to 2.1% in September instead of 1.7% indicated by the flash estimate. Due to the construction method of the HICP, the pandemic-induced expenditure shifts will continue to affect the index calculation until at least 2022.[5]
Chart 3
Contributions to annual HICP inflation in the euro area
(annual percentage changes; percentage point contributions)
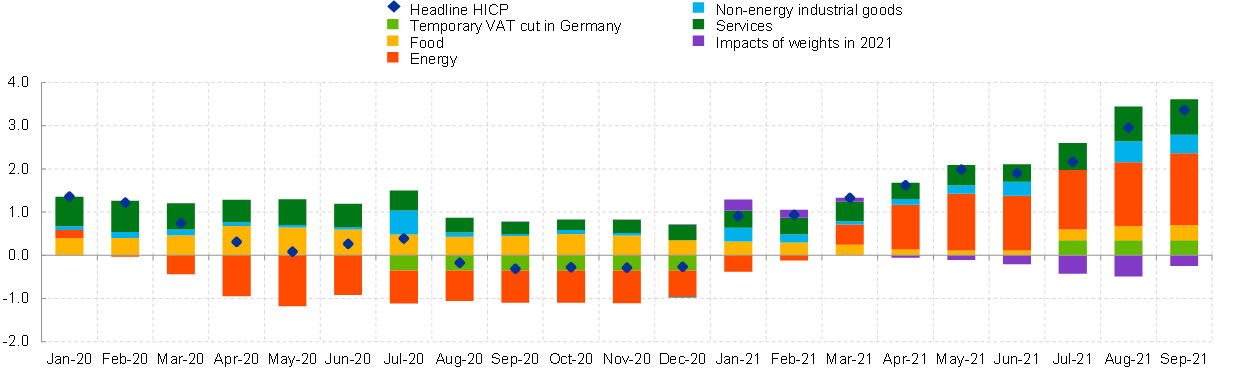
Source: Eurostat, Deutsche Bundesbank, September narrow inflation projection exercise (NIPE) and ECB calculations.
Notes: Contributions from main HICP components exclude the impact of changes in HICP weights and the VAT rate cut in Germany. The impact of weight changes is estimated by the ECB. The contribution made by the temporary VAT cut in Germany is based on estimates provided in the Deutsche Bundesbank’s November 2020 Monthly Report.
Latest observation: September 2021 (flash estimate).
Two further pandemic-related factors are also having a temporary – if somewhat more durable – impact on inflation. First, continued supply chain disruptions, augmented by the global economic recovery, are pushing up producer prices due to supply and demand imbalances, thus feeding into non-energy industrial goods inflation, which has been exceptionally strong recently (Chart 4, left panel). Second, the re-opening of the economy has pushed up services inflation to 1.1% in August and 1.7% in September according to the flash estimate.[6] This recent surge in services inflation is predominantly due to rising price pressures in high-contact services (Chart 4, right panel).
Chart 4
Non-energy goods and services inflation
(annual percentage changes; percentage point contributions)

Sources: Eurostat and ECB staff calculations.
Note: Series are shown with constant 2020 weights.
Latest observations: August 2021.
Speaking metaphorically, the current inflationary spike can be compared to a sneeze: the economy’s reaction to dust being kicked up in the wake of the pandemic and the ensuing recovery. And even though these pandemic-related developments are currently dominating media headlines, chances are high that the current episode of above-target inflationary pressures will subside over time.
In our baseline projections, we assume that the supply bottlenecks as well as the impact of the re-opening will normalise over the course of 2022. The latest data and survey results, including findings on potential second-round effects in wage bargaining, do not suggest that price pressures will persist.[7] At present, headline inflation is forecast to fall back below our medium-term inflation target of 2% in the medium term (Chart 5). Similarly, core inflation is projected to rise only gradually.
Chart 5
Eurosystem inflation projections
(annual percentage changes)
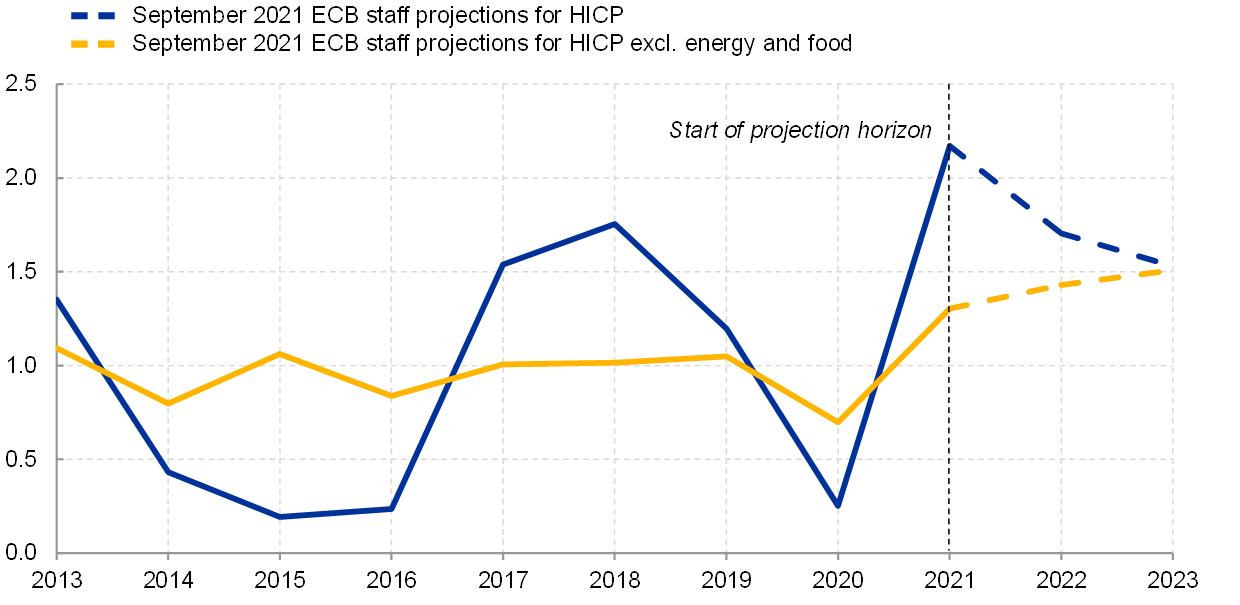
Source: ECB.
Note: The chart is based on annual inflation data.
Latest observation: August 2021, September 2021 Macroeconomic Projections.
Medium-term outlook: feeling the breeze
However, it would be premature to assert that current price dynamics will fully subside next year. The persistence of inflationary pressures ultimately depends on whether the dust kicked up by the pandemic continues to settle as the economic recovery takes hold. There are several sources of uncertainty that might entail more persistent inflationary pressures.
As we form our assessment of the medium-term inflation outlook, we keep our finger in the wind to determine whether the breeze will turn out to be more long-lived than just a transitory gust. It is also possible that the pandemic has altered or reinforced structural trends, thus affecting inflation dynamics in the years to come. The remarkable increase in the pace of digitalisation and the mounting efforts to fight climate change are a case in point.
Against the background of research contributions presented at this conference, I would like to highlight two additional, and possibly related, types of uncertainty that will determine whether current inflationary trends will turn out to be more persistent.
First, the current uptick in inflation might result in a more enduring upward revision of expectations about nominal costs and inflation. And second, the pandemic may have triggered behavioural changes that alter rigidities at microeconomic level, such as wage and price stickiness, thus having an impact on the slope of the Phillips curve.
The role of inflation expectations
Let me begin with inflation expectations. The standard prescription for monetary policy is to “look through” temporary supply-side shocks and to only take policy action if inflation expectations and wage bargaining give rise to second-round effects posing a threat to price stability. The difficulty with this prescription is that aggregate inflation expectations are unobservable, requiring policymakers to employ various proxy measures.
One method is to use market-based measures of inflation compensation. Immediately prior to the pandemic, estimates derived from market prices pointed to medium-term inflation expectations of only 1.1%, substantially below our medium-term inflation target (Chart 6, left panel). With the onset of the pandemic and the severe disruption to economic activity, these expectations declined to nearly 0.5% in March 2020.
In that regard, the recent increase in market-based inflation expectations along the entire maturity distribution to levels closer to our target is a welcome development. It signals that investors have become more sanguine about the euro area inflation outlook without pointing – so far at least – to fears of more persistent inflation overshoots that could spiral back into actual price and wage dynamics.
And since inflation expectations help to determine the real interest rate, higher inflation expectations reinforce the degree of policy accommodation in an environment of low nominal yields, and thus contribute to lifting inflation towards our new symmetric medium-term target of 2%.
Chart 6
Survey and market-based inflation indicators for the euro area
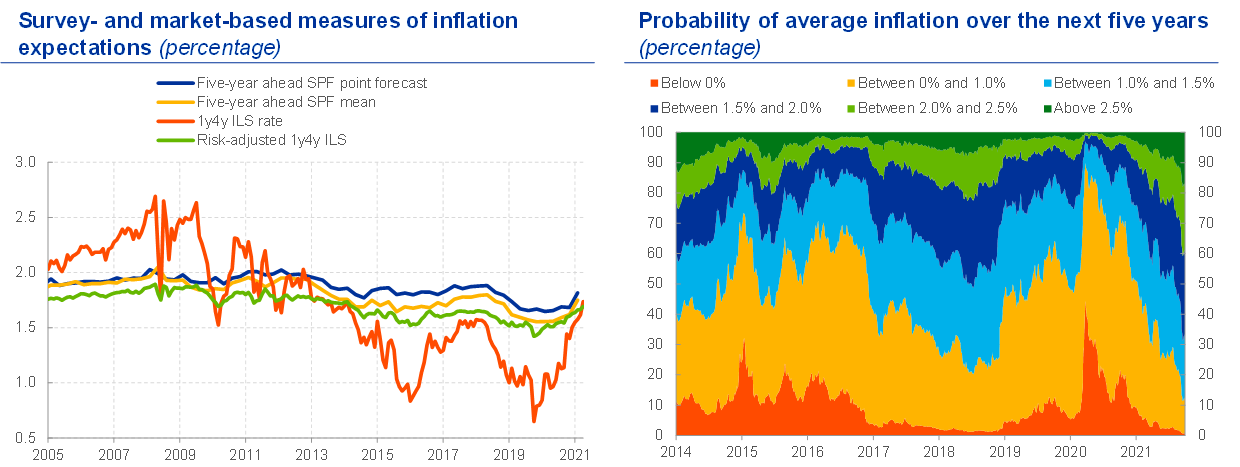
Left-hand panel:
Source: Bloomberg, Refinitiv and Eurosystem staff calculations.
Notes: SPF stands for Survey of Professional Forecasters. The risk adjustment is based on an affine term structure model and fitted to the euro area zero-coupon inflation-linked swaps (ILS) curve. The estimation method follows Joslin et al. (2011). For details, see Camba-Mendez and Werner (2017).
Right-hand panel:
Source: Bloomberg, Refinitiv, ECB calculations.
Notes: Probabilities implied by five-year zero-coupon inflation options, smoothed over five business days. Risk-neutral probabilities may differ significantly from physical, or true, probabilities.
Another method of gauging inflation expectations is to rely on survey-based metrics. For the euro area, these expectation proxies are derived from surveys of professional forecasters, households and businesses.[8] Similar to market-based measures, survey-based measures of inflation expectations have exhibited a notable uplift in the wake of the recovery from the pandemic but remain below our target (Chart 6, left panel).
In other words, there is currently no indication that elevated inflation rates are becoming entrenched in medium and longer-term inflation expectations in the euro area, entailing risks for price stability. On the contrary, recent developments across indicators suggest that investors and professional forecasters are increasingly internalising our new monetary policy strategy as well as our recently revised forward guidance, bringing us closer to our inflation target of 2 percent.
In short, we will only start raising our key policy rates once we are confident that inflation has durably converged to our target well ahead of the end of our projection horizon, and we judge that realised progress in underlying inflation is sufficiently advanced to be consistent with inflation stabilising at 2% over the medium term.
In an environment of measurable movements in inflation expectations, insights regarding their role in monetary policy transmission remain crucial for the policy deliberations of central banks. In the post-pandemic context, it is particularly challenging to discern whether changes in measures of expectations indicate a more fundamental change that may durably impact the transmission of monetary policy.
So what can research tell us?
Recent research in this area – including several papers presented at this conference – has helped shed light on how different types of inflation expectations are formed, how reliable the various measures are, and what these findings may imply for the conduct of monetary policy.
How reliable are surveys of professional forecasters, for example? One of the conference papers identifies an intriguing mechanism whereby even rational forecasters might report a biased measure of their true expectations, with individual forecasts over-reacting to private information, while under-reacting to publicly available information.[9]
Moreover, aggregating inflation expectations as a point estimate can be misleading because it disregards the distribution of inflation expectations. For instance, probability distributions of inflation expectations derived from option prices show a clear shift in recent months. Following a long period of market-based distributions of inflation expectations being persistently skewed to the downside, the probability of option-implied inflation rates above 2.0% over the next five years has recently reached its highest level since 2012 at 40%(Chart 6, right panel).
Such distributions are likely to matter even more in the case of households and businesses who often lack accurate knowledge of the official inflation rate or even the central bank’s inflation target, resulting in a wide distribution of inflation expectations. Indeed, new survey evidence in one of the conference papers confirms that inflation expectations of US firms are far from anchored.[10]
For central banks, these findings highlight the importance of communicating our monetary policy objectives effectively – an important consideration in our strategy review and in our decision to adopt a symmetric inflation target of 2% over the medium term.[11] Another conference paper addresses this issue by presenting empirical evidence corroborating the hypothesis that central bank communication focusing on the goals of monetary policy actions is more effective than communication focusing on individual monetary policy instruments.[12]
Behavioural changes due to the pandemic
The second source of uncertainty I would like to discuss today relates to potential behavioural changes induced by the pandemic. Microeconomic rigidities such as those stemming from wage- and price-setting behaviour have profound implications for the transmission of monetary policy. Collectively, these rigidities play a crucial but subtle role in determining the location and slope of the Phillips curve – a reduced form description of how changes in aggregate demand put pressure on inflation. This relationship can arise from underlying structural relations in a wide class of state-of-the-art sticky price models, as one paper at this conference will show.[13]
Model simulations and recent empirical evidence indicate that the slope of the Phillips curve may have flattened considerably over recent decades, a finding that continues to generate substantial debate in academia and policy circles (Chart 7).
Chart 7
Change in the slope of the Phillips curve
(x-axis: log percentage points, y-axis: percentage points)

Source: Costain, J., Nakov, A. and Petit, B. (2021), “Flattening of the Phillips Curve with State-Dependent Prices and Wages”, The Economic Journal, July.
Note: The top panels show scatterplots of the change in inflation and the output gap in US data over the periods 1980-2000 and 2000-2020, respectively. The bottom panels illustrate simulated data generated by a model of state-dependent price and wage setting (Costain et al., 2021) for the same time periods. The analysis indicates that the model explains roughly half of the observed flattening of the Phillips curve. According to the model, lower inflation in the second period (2000-2020) has reduced the frequency of price changes, implying a reduced transmission of demand shocks to the aggregate price level.
Such a change would have significant implications for the conduct of monetary policy. When inflation is below target, a flatter structural Phillips curve may imply that a greater degree of policy accommodation is required to return to target. In turn, a flatter Phillips curve implies that more forceful monetary policy tightening may be necessary to lower inflation that surpasses the central bank’s target.
However, like inflation expectations, the slope of the Phillips curve is not directly observable, and estimates differ depending on the models they are derived from. Research presented at this conference suggests that one has to be careful in the estimation of the Phillips curve relationship in order to avoid confusing a changing slope with a shift in inflation expectations.[14]
A further key structural determinant of the slope of the Phillips curve is the rate at which firms reset prices, affecting the responsiveness of the price level to changes in economic activity. Some have argued that the low rates of inflation witnessed over the past decade have reduced the rate of price resets, since firms are less likely to find themselves significantly away from their optimal price.[15]
However, research conducted by the ECB and the PRISMA network on micro-level price data challenges this claim, finding no noticeable slowdown in the rate of price resets (Chart 8). Work in progress in the Eurosystem shows that the rate of price changes may even have increased during the pandemic.
Chart 8
Frequency of price changes: a comparison of IPN (data: 1996-2001) and PRISMA (data: 2011-2017) results
(percentages)
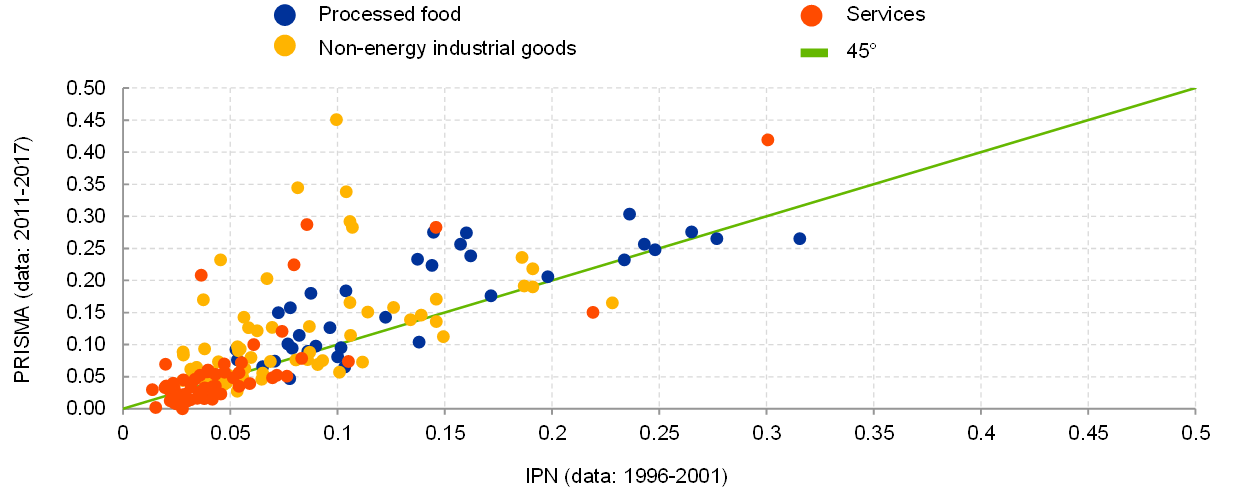
Source: Gautier et al. (2021), “New Facts on Consumer Price Rigidity in the Euro Area”, Working Paper Series, ECB (forthcoming).
Note: The chart shows the frequency of price changes documented by the Eurosystem Inflation Persistence Network (IPN) and the Price-Setting Microdata Analysis (PRISMA) network for a set of 50 product categories covered by both studies. From 2003, the IPN conducted an in-depth study of inflation persistence and price rigidity in the euro area by analysing a broad set of macro and micro data covering the period from 1996 until 2001. The IPN has concluded its work. The PRISMA network was set up in 2018 to deepen the understanding of price-setting behaviour and inflation dynamics in the EU by collecting and studying various types of microdata, including data underlying official price indices such as the Consumer Price Index (CPI) and the Producer Price Index (PPI), scanner data and online prices, covering the period from 2011 until 2017. The frequency of price changes displayed in the chart is measured as the fraction of all prices for each of the 50 product categories in the sample that change on a monthly basis.
This research is representative of a wider shift in the literature, which increasingly investigates the macroeconomic impact of heterogenous firm-level decisions. The impact of such firm-level decisions on macroeconomic outcomes has crucial implications for the transmission of monetary policy decisions to the real economy.
There is growing evidence that the aggregate change in the price level is not only determined by the average rate of price resets, but rather by the entire distribution of price adjustments. For example, a large number of relatively small changes (in absolute value) may imply relatively high stickiness in the aggregate price level. By contrast, if firms that are furthest away from their optimum price are more likely to adjust their prices – known in the literature as selection effects – the price level may be more flexible.
One conference paper that has been written under the PRISMA network finds evidence that the probability of price changes indeed depends on the extent of mispricing both for the United States and the euro area, as indicated by the V-shape in Chart 9. The x-axis shows how far a firm’s current price is from its optimal reset price, which proxies the gain from changing the price. The y-axis shows the probability of changing the price. Firms further away from the optimal reset price are indeed more likely to change prices.
However, the paper also shows that the probability of adjustment in response to monetary and credit shocks does not depend on the extent of mispricing. Hence, the paper finds little evidence that selection contributes significantly to the overall inflation response to an aggregate shock.[16] Thus, while some degree of state-dependence is present in the micro data, it appears that its effect is muted in the aggregate, rejecting the results of state-dependent models with high selection[17] and favouring models of the “rational-inattention” type with a low degree of selection.[18]
Chart 9
Evidence of state-dependence: repricing probability as a function of the price gap
(percentage)
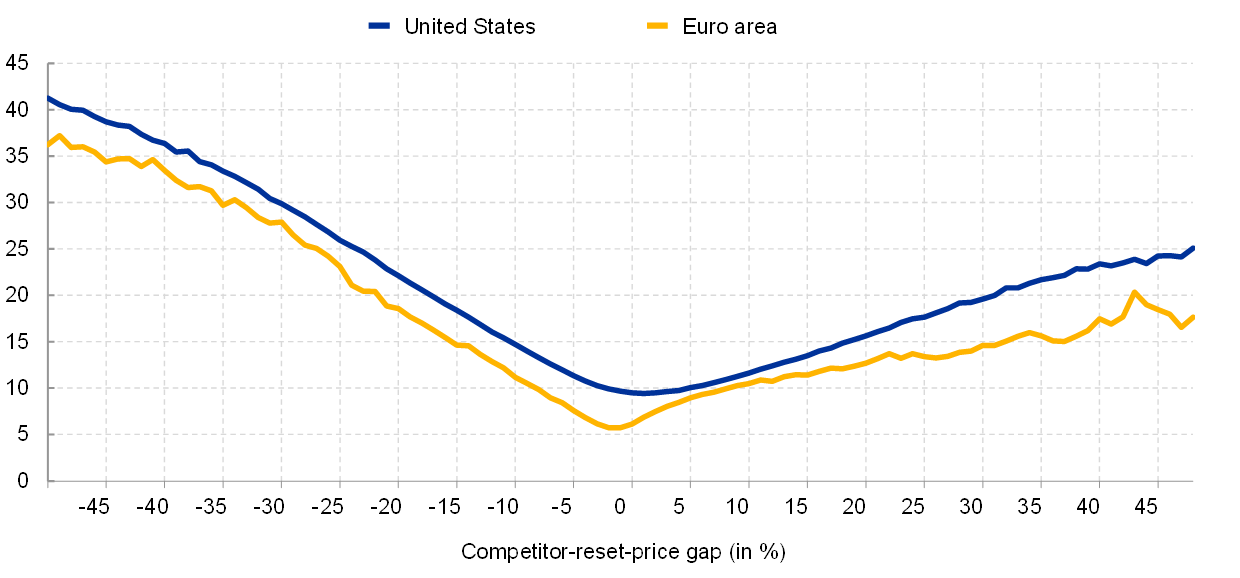
Source: Karadi, P., Schoenle, R. and Wursten, J. (2021), “Measuring Price Selection in Microdata: It’s Not There”, Working Paper Series, No 2566, ECB.
Note: The figure shows the probability of a price change as a function of mispricing in the euro area and the United States. The V-shape of the curve is consistent with state-dependent price setting: the probability of adjustment steadily increases with the extent of mispricing. The extent of mispricing is proxied as a distance from the average price of the same product among those competitors that reset their prices in the same month. The measure also controls for the persistent heterogeneity among products and stores by eliminating the impact of product-store fixed effects. Additional details on the methodology are available in ECB Working Paper No 2566.
From a policymaker’s perspective, it is encouraging to witness the efforts to translate the impact of micro-level distributions into macroeconomic representations of policy transmission, for example through the creation of informative statistics based on micro-level data, as done in one of the conference papers.[19] These findings generate constructive input for our policy discussions on the transmission of monetary policy and, ultimately, help us to improve our knowledge regarding the underlying drivers of inflation dynamics in the euro area.[20]
Conclusion
Let me conclude.
Current inflationary pressures in the euro area are driven by pandemic-related factors that can be expected to largely fade out over the course of next year. Overreacting to such short-term volatility would be harmful and risk jeopardising the ongoing economic recovery, which is why the ECB’s monetary policy remains focused on fulfilling its medium-term price stability mandate.
Nonetheless, significant uncertainty remains as to how persistent some of the current price pressures will prove to be. The ECB therefore continues to carefully monitor inflationary developments in the euro area, with a particular focus on second-round effects, to determine whether the headwinds that have exerted downward pressure on inflation for much of the past decade are still present, or whether they may reverse in the aftermath of the pandemic.
The cyclical and specific pandemic factors will increasingly be overlaid by structural changes, which can go in different directions.[21] Structural factors such as globalisation, the fight against climate change, demographic trends and digitalisation are likely to continue to affect prices and price-setting, and hence the transmission of our policy, but the direction is still unclear.[22]
High-quality academic research into the underlying drivers of inflation dynamics hence remains a vital input for our monetary policy deliberations. I therefore look forward to hearing more about the insightful papers and novel research findings that will be presented at this conference.
Thank you.
- I would like to thank Miles Parker for his support in preparing this speech.
- ECB staff recently published several occasional papers related to the monetary policy strategy review. These are available on the ECB website and summarise the analysis that fed into the Governing Council’s discussions on each topic.
- Koester, G., Lis, E., Nickel, C., Osbat, C. and Smets, F. (2021), “Understanding low inflation in the euro area from 2013 to 2019: cyclical and structural drivers”, Occasional Paper Series, No 280, ECB, September.
- See also Schnabel, I. (2021), “Escaping low inflation?”, speech at the Petersberger Sommerdialog, 3 July.
- See Kouvavas et al. (2020), “Consumption patterns and inflation measurement issues during the COVID-19 pandemic”, Economic Bulletin, Issue 7, ECB.
- The recent rise in services price inflation has been mitigated somewhat by the recent change in consumption weights. Using the consumption weights that were applicable in 2020, services price inflation would have reached 2% in August, as shown in Chart 4 (right panel).
- Koester, G., Nordeman, J. and Soudan, M. (2021), “Comparing recent inflation developments in the United States and the euro area”, Economic Bulletin, Issue 6, ECB, September; European Central Bank (2021), “The ECB Survey of Professional Forecasters: Third quarter of 2021”, July.
- Surveys addressed to professional forecasters have included the ECB Survey of Professional Forecasters, Consensus Economics , Euro Zone Barometer and, more recently, the ECB Survey of Monetary Analysts. The ECB’s household survey is the Consumer Expectations Survey. The European Commission surveys both households and firms.
- Gemmi, L. and Valchev, R. (2021), “Public Information and Survey Expectations”, paper presented at this conference.
- Candia, B., Coibion, O. and Gorodnichenko, Y. (2021), “The Inflation Expectations of US Firms: Evidence from a New Survey”, NBER Working Paper, No 28836.
- Work stream on monetary policy communications (2021), “Clear, consistent and engaging: ECB monetary policy communication in a changing world”, Occasional Paper Series, No 274, ECB, September
- D’Acunto, F., Hoang, D., Paloviita, M. and Weber, M. (2021), “Effective Policy Communication: Targets Versus Instruments”, Working Paper Series in Economics, No 147, Karlsruhe Institute of Technology (KIT).
- Auclert, A., Dinis, R., Rognlie, M. and Straub, L. (2021), “New Pricing Models, Same Old Phillips Curves?”, paper presented at this conference.
- Hazell, E., Herreño, J., Nakamura, E. and Steinsson, J. (2021) “The Slope of the Phillips Curve: Evidence from U.S. States”, NBER Working Paper 28005, May.
- Costain, J., Nakov, A. and Petit, B. (2021), “Flattening of the Phillips Curve with State-Dependent Prices and Wages”, The Economic Journal, July.
- Karadi, P., Schoenle, R. and Wursten, J. (2021), “Measuring Price Selection in Microdata: It’s Not There”, Working Paper Series, No 2566, ECB.
- Golosov, M. and Lucas, R.E. (2007), “Menu Costs and Phillips Curves”, Journal of Political Economy, Vol. 115, No 2, pp. 171-199.
- Woodford, M. (2009), “Information-Constrained State-Dependent Pricing,” Journal of Monetary Economics, 56(S), pp. 100-124; Costain, J. and Nakov, A. (2019), “Logit Price Dynamics”, Journal of Money, Credit and Banking, Vol. 51, No 1, pp. 43-78.
- Alvarez, F., Ferrara, A., Gautier, E., Le Bihan, H. and Lippo, F. (2021), “Empirical Investigation of a Sufficient Statistic for Monetary Shocks”, EIEF Working Paper, 21/09.
- Another promising area of research is the analysis of monetary transmission in multi-sector models with production networks and input-output linkages. See Ghassibe, M. (2021), “Endogenous Production Networks and Non-Linear Monetary Transmission”; Rubbo, E. (2021), “Aggregation and Redistribution in New Keynesian Economies; papers presented at this conference.
- Lagarde, C. (2021), “Monetary policy during an atypical recovery,” speech at the ECB Forum on Central Banking “Beyond the pandemic: the future of monetary policy”, September.
- See also Work stream on digitalisation (2021), “Digitalisation: channels, impacts and implications for monetary policy in the euro area”, Occasional Paper Series, No 266, ECB, September; Work stream on globalisation (2021), “The implications of globalisation for the ECB monetary policy strategy”, Occasional Paper Series, No 263, ECB, September.
European Central Bank
Directorate General Communications
- Sonnemannstrasse 20
- 60314 Frankfurt am Main, Germany
- +49 69 1344 7455
- media@ecb.europa.eu
Reproduction is permitted provided that the source is acknowledged.
Media contacts- 7 October 2021