


Published as part of the ECB Economic Bulletin, Issue 1/2024.
Global trade dynamics in 2023 were still influenced by the legacy of the pandemic shock. When global activity collapsed at the start of the pandemic, triggering the deepest global recession (albeit short-lived) since the Second World War amid large-scale policy support, there was also a sweeping fall in world trade. In the first two quarters of 2020, global trade contracted by 16%, exceeding even the shock observed during the global financial crisis. In 2021 and 2022 it staged a rapid recovery, growing by 12.8% and 5.5% respectively and reaching pre-pandemic levels by the first quarter of 2021 (Chart A, panel a). However, during the second half of 2022 world trade growth started to decelerate markedly and, after dipping into negative territory in the fourth quarter, only began to gradually recover during 2023. According to the December 2023 Eurosystem staff macroeconomic projections, global trade may have grown by just 1.1% in 2023, well below its average annual growth over the pre-pandemic period (2012 to 2019) and subpar compared with global GDP growth in 2023 (Chart A, panel b).[1]
Chart A
World trade vs. trend
a) Levels | b) Growth rates |
|---|---|
(index, 2019 = 100) | (annual percentage changes) |
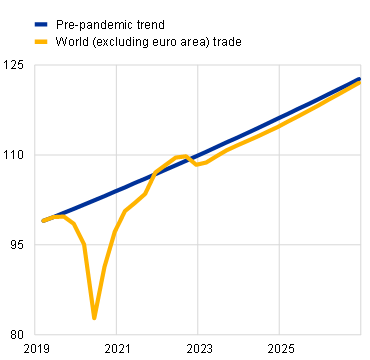 |  |
Sources: Haver Analytics, ECB staff calculations and December 2023 Eurosystem staff macroeconomic projections.
Notes: World trade refers to the aggregation of real imports across all countries, excluding the euro area. In panel a), trend growth is based on the average growth rate of the trend component of world trade from 2012 to 2019, obtained by an Hodrick-Prescott filtering of log values.
Buoyant global trade growth in 2021 and early 2022 was spurred by pandemic-specific factors. The most important of these was the rebound of overall economic activity after the initial COVID-19 shock. This was compounded by the rotation of global demand from services to goods. From the second half of 2020, there was a sharp recovery in goods demand as consumption patterns underwent an exceptional shift, with contact-based services consumption constrained by pandemic-related containment measures (Chart B) amid large-scale fiscal support to cushion the COVID-19 shock. Given the higher trade intensity of goods compared with services, this shift in demand patterns amplified the strong rebound in trade, which exceeded its pre-pandemic trend towards the end of 2021 (Chart A). At the same time, pandemic-related supply disruptions prevented an even sharper increase in global trade, raising delivery times globally. In 2022, trade growth was temporarily supported by firms building up their inventories amid stock-out fears. The normalisation of supply bottlenecks and the weakening of global demand helped companies to gradually clear backlogs of orders (Chart C). The recovery in international tourism travel and transportation was an additional tailwind for global trade throughout the year.
Chart B
World (excluding euro area) consumption vs. trend
a) Goods | b) Services |
|---|---|
(index, 2019 = 100) | (index, 2019 = 100) |
 | 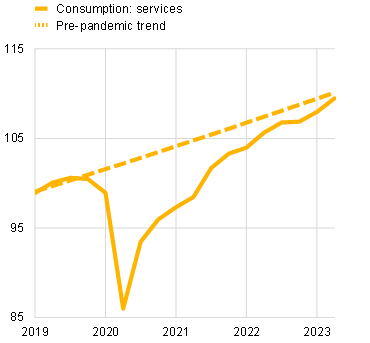 |
Sources: National sources, Organisation for Economic Co-operation and Development, and ECB staff calculations.
Notes: World consumption refers to an aggregation of private domestic consumption in 16 non-euro area countries accounting for 48% of world GDP, weighted by country shares in world (excluding euro area) consumption. Trend growth is based on the average growth rate from 2012 to 2019. The latest observation is for the third quarter of 2023.
Chart C
Inventories, backlogs and bottlenecks
(left-hand scale: standardised changes in deviation from 2012-2019 average; right-hand scale: diffusion index)
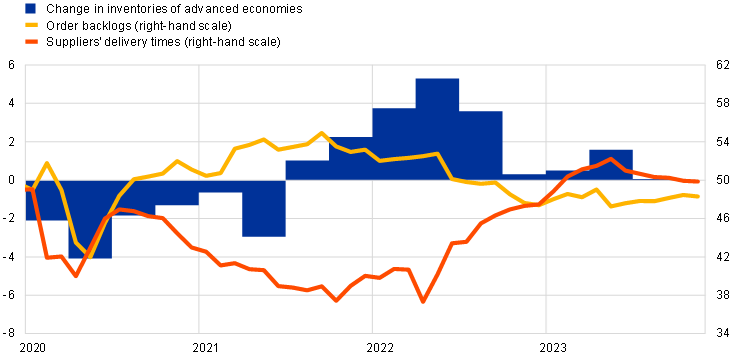
Sources: Haver Analytics, S&P Global, and ECB staff calculations.
Notes: Excludes the euro area. Real inventories are calculated as the principal component of standardised measures of national account data for Australia, Canada, Japan, New Zealand, Norway, Sweden, the United Kingdom and the United States. A diffusion index is constructed for suppliers’ delivery times and order backlogs according to the proportion of respondents reporting an improvement (a deterioration) in economic conditions; a value above (below) 50 means that a higher proportion of respondents reported an improvement (a deterioration). The latest observation is for November 2023 for suppliers’ delivery times and order backlogs, and the third quarter of 2023 for changes in real inventories.
The subsequent weakness in global trade in 2023 reflects a less trade-friendly composition of global economic activity and the unwinding of the abovementioned exceptional factors. First, real GDP growth slowed more strongly in advanced economies (AEs) – where domestic demand is more import-intensive – than in emerging market economies (EMEs).[2] Second, while private consumption recovered sharply, private investment remained weak, reflecting a combination of tighter monetary policy, higher uncertainty amid intensified geopolitical tensions, and the unwinding of pandemic-related fiscal support measures. Estimates from import-demand models suggest that around half of the drop in global trade since 2022 can be attributed to these weaker fundamentals, particularly the lacklustre momentum in investment, which turned negative in the last quarter of 2022 (Chart D).[3] Beyond the role of fundamentals, the model suggests that other factors were at play in early 2023 (having started in late 2022), as indicated by the large negative residuals. These residuals are possibly related to the unwinding of the pandemic-specific factors mentioned above, including the fact that demand started to rotate back from trade-intensive goods towards services owing to the full relaxation of pandemic containment measures (Chart B), further weighing on trade momentum. This shift in consumption patterns is also consistent with the observed moderation in global manufacturing activity. As the manufacturing sector is highly trade-intensive, a sharp slowdown in manufacturing output is associated with a more pronounced decline in global trade than in global GDP.[4]
Chart D
Contributions to world trade growth
(quarterly percentage changes, percentage points)
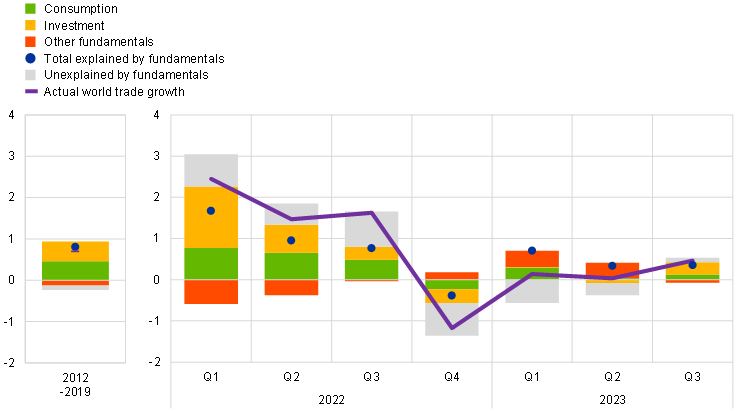
Sources: World Input-Output Database (WIOD), Haver Analytics, and ECB staff calculations.
Notes: World trade refers to an aggregation of real imports across 17 non-euro area countries accounting for 58% of world (excluding euro area) imports. Owing to data limitations, China is not included in the sample. The latest observation is for the third quarter of 2023.
The drivers of these developments can be illustrated by a structural decomposition of world trade based on a Bayesian vector autoregression (Chart E).[5] The initial trade collapse is explained by a sharp decline in demand in the first half of 2020, which was followed by a period of buoyant demand, somewhat dampened by the supply bottlenecks that materialised in the course of 2021. The supply bottleneck shock turned from negative to positive in early 2022 amid the gradual normalisation of supply disruptions, supporting trade even as demand began to moderate and the energy supply shock kicked in.[6] Falling domestic demand then caused a marked deceleration in global trade, notably in the fourth quarter of 2022. The contribution of demand to global trade progressively recovered throughout 2023, with pandemic-specific factors broadly normalising.
Chart E
Shock decomposition of world trade growth
(quarterly percentage changes in deviation from 2012-2019 average, percentage points)
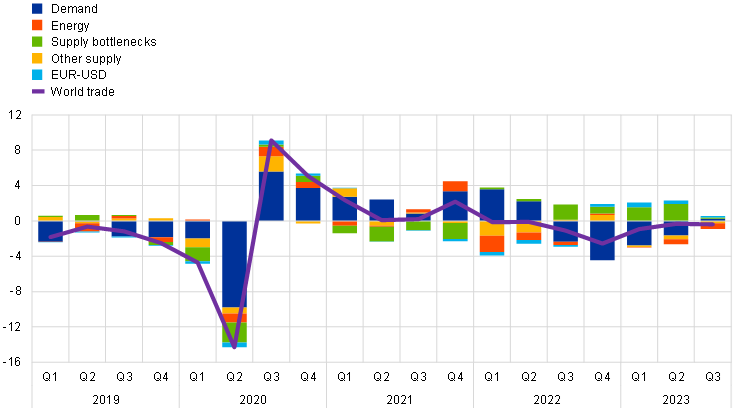
Sources: Haver Analytics, Federal Reserve Bank of New York, and ECB staff calculations.
Notes: World trade refers to world (excluding euro area) imports. The shock decomposition is based on a BVAR model with five variables (world imports, world export prices, the Global Supply Chain Pressure Index, oil prices, and the EUR/USD exchange rate). Structural shock identification is achieved by means of zero and sign restrictions. The latest observation is for the third quarter of 2023.
Global trade growth is forecast to recover over the projection horizon, with trade flows expected to align more closely with fundamentals (Chart D) and converge towards the long-term trend (Chart A, panel a). Now that supply bottlenecks and the inventory cycle are broadly back to normal levels (Chart C), inventory accumulation is expected to evolve in a manner that is more in line with historical norms. Moreover, incoming survey data for sectoral services output point to a significant deceleration compared with the strong growth recorded during the first half of 2023, suggesting that the impetus from the post-pandemic re-opening has largely run its course. This implies that the composition of consumer demand is on a normalisation path and that the rotation towards services consumption is almost over – as also suggested by goods and services consumption converging towards their pre-pandemic trend (Chart B). The December 2023 Eurosystem staff macroeconomic projections forecast a gradual recovery in world trade growth (excluding the euro area) to 3.0% in 2024 (up from 1.1% in 2023), broadly in line with the long-term unitary elasticity of world trade to world GDP.[7] This would also imply that the level of trade will gradually return to the pre-pandemic trend towards the end of the projection horizon (Chart A, panel a).[8] The trade projections are also in line with the forecasts from peer institutions that point to a normalisation of the world trade outlook from 2024 onwards.[9]
Looking ahead, the balance of risks to global trade is assessed as broadly balanced. Trade in goods and services could be boosted, inter alia, by an increased uptake of digital services – including those related to artificial intelligence. At the same time, the introduction of policies aimed at reshoring production (especially of critical goods and technologies) in the context of growing trade tensions, notably between the United States and China (for example, the US CHIPS and Science Act, China’s dual circulation strategy and the US Inflation Reduction Act) could reduce trade volumes.[10] More generally, a fragmentation of trade along spheres of political influence could weigh on trade even as cyclical factors normalise. While there is thus far little evidence to suggest that deglobalisation has significantly hampered aggregate trade, the number of trade barriers has been rising since 2019, and soft indicators based on firms’ earning calls suggest that mentions of “reshoring” or “friend-shoring” have increased markedly since 2022 (Chart F).[11] Moreover, a recent European Central Bank survey of large EU corporate firms shows that over the next five years these firms expect to become more active in relocating operations in order to make their business model more resilient.[12]
Chart F
Global incidence of reshoring-related terms in firms’ earnings calls
(sentences containing at least one of the search phrases, as a proportion of all sentences recorded during firms’ earnings calls, percentages)
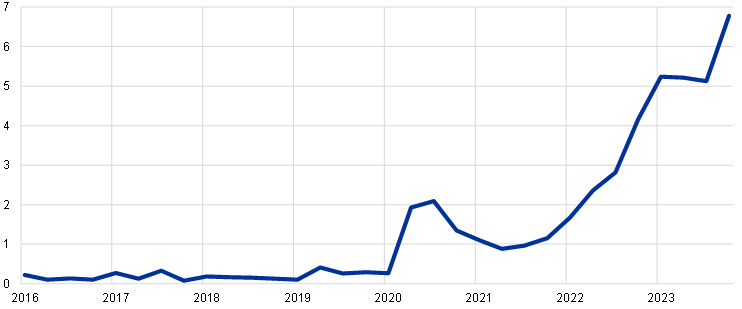
Sources: NL Analytics and ECB staff calculations.
Notes: Firm-level incidence rates are averaged across all firms and across each quarter. The search phrases were “friend-shoring”, “near-shoring”, “on-shoring”, and “reshoring”. The latest observation is for the third quarter of 2023.
See Box 2 of “Eurosystem staff macroeconomic projections for the euro area, December 2023”, published on the ECB’s website on 14 December 2023.
Import intensity refers to the share of a country’s final demand that is directly or indirectly linked to imports. On average, the import intensity of domestic demand is around 20% in EMEs, compared with 30% in AEs. In the same vein, the import intensity for global consumption is around 20%, compared with 40% for investment. Finally, the import intensity is around 45% for the consumption of goods, compared with only 15% for the consumption of services. Import intensities are computed based on the trade in value added (TiVA) input-output tables of the Organisation for Economic Co-operation and Development (OECD) for 2019, and following the methodology set out in Bussière, M., Callegari, G., Ghironi, F., Sestieri, G. and Yamano, N., “Estimating Trade Elasticities: Demand Composition and the Trade Collapse of 2008-2009”, American Economic Journal: Macroeconomics, Vol. 5, No 3, 2013, pp. 118-151.
Contributions, as shown in Chart D, are obtained from error correction models for individual countries that relate import volumes to domestic demand components and relative import prices. Measures of import intensity-adjusted demand are computed by weighting the components of domestic demand according to their import intensity. Non-linear deterministic trends are included in the long-term relationships to capture factors such as shifts in non-price competitiveness or changes in trade openness. “Other fundamentals” include contributions from the relative prices and the trends.
Manufactured goods account for 81% of world total imports of goods and services but only 20% of world value added (with services accounting for 19% and 80% respectively).
The estimation is based on a Bayesian vector autoregression (BVAR) with five series: the Federal Reserve Bank of New York’s Global Supply Chain Pressure Index (GSCPI), world (excluding euro area) imports, world (excluding euro area) export prices on national currencies, oil prices and the EUR/USD exchange rate. The model is estimated at quarterly frequency from the first quarter of 1998 until the first quarter of 2023. The identification of the model’s five shocks (global demand, energy, supply bottlenecks, other supply and the EUR/USD exchange rate) is based on zero and sign restrictions.
The limited contribution of the energy supply shock to world trade in 2022 (and its positive contribution in the fourth quarter of 2021) could stem from the following factors: (1) higher energy prices also act as a drag on demand, as income is redistributed from energy importers to energy exporters, which typically have a lower marginal propensity to spend, and (2) the analysis excluded the euro area, where the recent energy price shock has been disproportionately strong. The magnitude of the energy supply shock is robust to alternative measurements of energy prices, including a synthetic index combining oil and gas prices. The limited impact of the energy supply shock on the volume of trade is also in line with the literature – see, for example, Sato, M., and Dechezleprêtre, A., “Asymmetric industrial energy prices and international trade”, Energy Economics, Vol. 52, 2015, pp. 130-141, and similar estimations of trading volumes based on a structural VAR. For extra-euro area exports, see the box entitled “The energy shock, price competitiveness and euro area export performance”, Economic Bulletin, Issue 3, ECB, 2023. The effect of financial factors on world trade is assumed to be captured by the demand shock, as financial constraints hindered borrowing capacities. Nevertheless, financial factors are estimated to have played a limited role in shaping trade since the pandemic (see, for example, Simola, H., “Consumption and service sector demand played a key role in the COVID-19 global trade collapse”, VoxEU.org, 24 November 2021).
See IRC Trade Task Force, “Understanding the weakness in global trade – what is the new normal?”, Occasional Paper Series, No 178, ECB, Frankfurt am Main, September 2016.
See Box 2 of “Eurosystem staff macroeconomic projections for the euro area, December 2023”, op. cit.
For instance, in 2024 the annual growth rate of world trade is forecast to reach 3.5% by the International Monetary Fund (IMF), 2.7% by the OECD, 3.3% by the World Trade Organization (WTO, only merchandise trade), 3.0% by the European Commission and 2.8% by the World Bank. The IMF figure is taken from its October 2023 World Economic Outlook, the OECD figure is taken from its November 2023 Economic Outlook, the WTO figure is taken from its October 2023 Global Trade Outlook, the European Commission figure is taken from its Autumn 2023 Economic Forecast, and the World Bank figure is taken from its June 2023 Global Economic Prospects.
Under the “dual circulation” strategy adopted in 2020, China is aiming to (1) vertically integrate its production and become self‐sufficient, aided by its large domestic market, and (2) globalise Chinese companies through the Belt and Road Initiative. In the United States, the CHIPS and Science act of 2022 introduced large subsidies and incentives for the research, development and production of technological components. The US Inflation Reduction Act of 2022 aims to increase the ability of the United States to attract key green technologies, using large sectoral production subsidies and significant financial incentives (for example, tax credits for the purchase of electric vehicles and investments in renewable energy equipment) that are conditional on domestic content requirements.
Empirical evidence on how geoeconomic fragmentation affects trade is scarce, with no significant effect found on aggregate trade (Di Sano, M., Gunnella, V. and Lebastard, L., “Deglobalisation: risk or reality?”, ECB Blog, ECB, 12 July 2023). Further empirical evidence shows that the application of trade barriers between two countries generally results in trade being diverted via a third country, meaning that no impact is found on aggregate trade (see Freund, C., Mattoo, A., Mulabdic, A. and Ruta, M., “Is US Trade Policy Reshaping Global Supply Chains?”, VoxEU.org, 31 August 2023).
See the box entitled “Global production and supply chain risks: insights from a survey of leading companies”, Economic Bulletin, Issue 7, ECB, 2023. It is unclear what impact reshoring will have on aggregate world trade growth, however. It will depend on whether a significant share of euro area corporate firms opt to relocate extra-euro area suppliers towards the euro area – which could hamper aggregate trade growth – or to other extra-euro area countries (e.g. from China to Vietnam), which in this case would affect the geography of trade flows but possibly have only a limited impact on aggregate trade growth.