


Published as part of the ECB Economic Bulletin, Issue 8/2023.
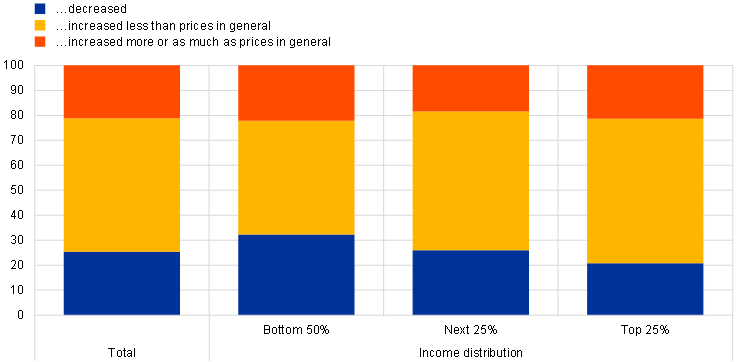
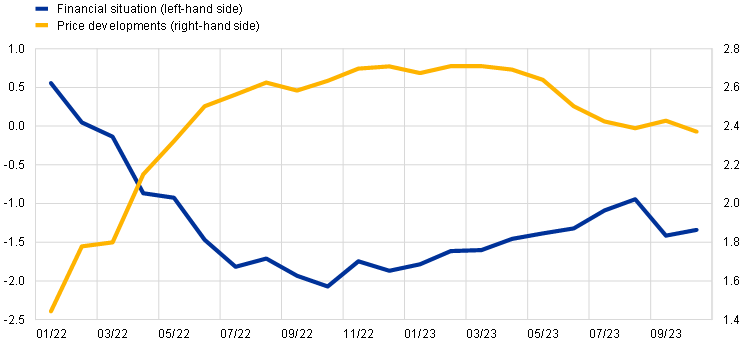
In the light of recent survey results, this box reviews the latest developments in household disposable income, focusing on some conceptual and measurement issues. Evidence from the ECB’s Consumer Expectations Survey (CES) at the end of September 2023 shows that about 21% of households in the euro area reported an increase in their income above or equal to inflation in the past 12 months, while 54% of respondents reported an increase below inflation and 25% reported a decrease in their income (Chart A, panel a). This relatively negative assessment of recent real income dynamics was shared quite evenly along the income distribution.[1] Moreover, this assessment is in line with the European Commission’s survey results which indicate that consumers’ perceptions of their financial situation over the last 12 months have recently been significantly below their long-term average, especially since the surge in inflation following the outbreak of the war in Ukraine (Chart A, panel b). However, it contrasts with the positive momentum in household disposable income as measured in the national accounts, which increased by an average of 8.6%, year on year, in the first half of 2023 (Chart B), corresponding to an increase in real disposable income of 1.1% in the same period.[2] This divergence between survey results and national accounts data calls for a detailed look at recent trends in household disposable income and their implications for the outlook for private consumption.
Chart A
Consumers’ perceptions about developments in their income and financial situation
a) Perceptions about income in the past 12 months relative to prices
(percentages of consumers)
b) Perceptions about past financial situation and price developments
(standardised percentage balances)
Sources: CES, European Commission and ECB calculations.
Notes: For panel a), CES respondents were asked at the end of September 2023 to indicate whether their total net income had risen more than prices in general, risen less than prices in general, had fallen or had changed by roughly the same amount as prices in general over the last 12 months. For panel b), households’ perceptions about their past financial situation and about price developments are standardised over the period 2000-19.
Household disposable income has benefited from rising labour income and continued strong growth in non-labour income. Both compensation of employees and all other components of household income, excluding net fiscal income, continued to rise significantly in the first half of 2023 in annual terms. Compensation of employees increased by an average of 7.1% in the period and non-labour income excluding net fiscal income rose by 8.3%, such that both components made a significant contribution to growth in disposable income (Chart B). Net fiscal income had no significant impact on household income dynamics in the second half of 2022 and the first half of 2023, while it had a negative effect on household income in the first half of 2022.[3] A detailed look at other (i.e. non-labour) household income, excluding net fiscal income, shows that all key components increased significantly in the first half of 2023. Mixed (self-employed) income increased by 6.8%, gross operating surplus by 9.6% and net property income by 8.8%.[4] While growth in mixed income has been relatively constant, growth of the gross operating surplus has accelerated significantly, and in the first half of 2023 it reached its highest growth rate since the data series began in 1999. Net property income excluding financial intermediation services indirectly measured (FISIM) was supported by strong growth in dividends in 2022.[5] FISIM then rose strongly in the first half of 2023 and, despite accounting for a small share of total income, contributed 0.6 percentage points to household disposable income growth in the first half of 2023.
Chart B
Developments in nominal household income
(annual percentage changes and percentage point contributions)

Sources: ECB and Eurostat quarterly sector accounts and ECB calculations.
Note: The figures in parentheses are the shares of disposable income attributable to the listed income items for 2022.
Not all components of household disposable income are available to households as positive cash flow. The measurement of household disposable income in the national accounts differs from household cash flows for conceptual reasons, as the aim of the national accounts is to measure economic activity, including household income, as comprehensively and accurately as possible. This means that data from many different sources must be combined and variables for which no direct data are available must be estimated.[6] Consequently, not all the components of disposable income measured in the national accounts are available to households as positive cash flow and may therefore not be reflected in household perceptions of their income (Table A).This mainly relates to non-labour income excluding net fiscal income, which benefited in the first half of 2023 compared with the second half of 2022 primarily from the exceptionally strong growth in the gross operating surplus and the strong rise in FISIM, neither of which generated a positive cash flow for households (Chart B).
Table A
Income components and their availability as cash flows
Income component | National accounts | Cash flow-generating? | |
|---|---|---|---|
Labour income | Compensation of employees | Wages and salaries (in cash and in kind) | Yes |
Employers’ actual social contributions | No | ||
Employers’ imputed social contributions | No | ||
Non-labour income excluding net fiscal income | Income from self-employment | Mixed income | Yes |
Income from rental of residential and non-residential property | Mixed income | Yes | |
Imputed rents | Operating surplus | No | |
Interest received before FISIM allocation | Property income received | Yes | |
Interest paid before FISIM allocation | Property income paid | Yes | |
FISIM | Mixed income, operating surplus, net property income | No | |
Other investment income (e.g. dividends) and rents (on land and subsoil resources) received | Property income received | Yes | |
Property income attributed to insurance policyholders | Property income received | No | |
Net fiscal income | Social benefits received (other than social transfers in kind), social contributions (including employers’ social contributions) and taxes on income paid, taxes on wealth paid | Yes | |
Social transfers in kind received | No | ||
Sources: Eurostat and ECB staff assessment.
Note: Employers’ (actual and imputed) social security contributions do not affect household disposable income, as they are part of both employee remuneration and net fiscal income, so they increase income as part of the former and decrease income as part of the latter.
FISIM represents the financial intermediation services provided by financial institutions that are not explicitly invoiced but are relevant for the measurement of the output of banks and thus may have an impact on GDP and national income.[7] Household interest payments on consumer loans and mortgages and the interest earned on deposits are recorded at the interbank refinancing rate in the national accounts.[8] However, this rate differs from interest rates that households actually face, as lending rates are generally higher and deposit rates lower than the interbank rate. The difference between the interest paid and received as measured in the national accounts and the actual amounts is recorded as an implicit service charge paid by households to the financial sector, which is reported in the national accounts as FISIM. Thus, FISIM is used in the national accounts to compute the value added of financial intermediaries (e.g. banks) for financial services provided without explicit service charges. For the household sector, this indirectly measured margin is allocated both to consumption (as a financial service to households) and to disposable income (to reimburse the indirect loss of income resulting from the less favourable interest rates to which households are actually exposed), without any impact on household savings.
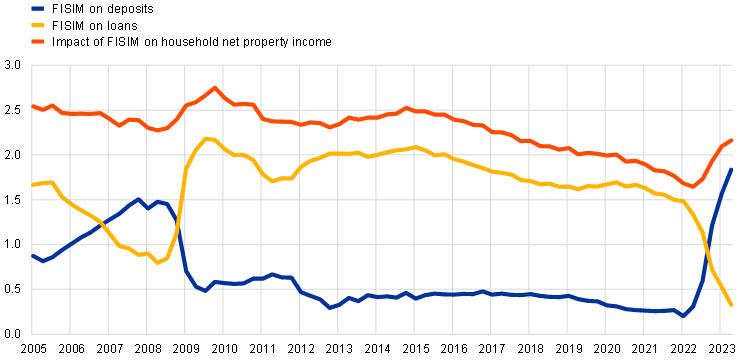
FISIM plays a particularly important role for household income and consumption in the current context of sharply rising interest rates.[9] FISIM has a noticeable impact on the dynamics of household disposable income at times of large changes in interest rates, such as in the current phase of monetary tightening (Chart C). As the interest rates on outstanding loans and on household deposits are generally slow to adjust, the increase in the interbank interest rate triggered by the tightening of monetary policy since the summer of 2022 has led to a strong rise in FISIM for deposits and a sharp fall in FISIM for loans. Given the size of deposits held by households compared with their loans, this has ultimately had a positive impact on households’ net property income, with FISIM rising from an average of 1.7% of household disposable income in the first half of 2022 to 2.1% in the first half of 2023.
Chart C
Financial intermediation services indirectly measured
(percentages of household disposable income)
Sources: ECB and Eurostat quarterly sector accounts and ECB calculations.
Notes: FISIM on deposits is calculated as the difference between the interest households received after the FISIM allocation and the interest actually received, while FISIM on loans is the difference between the interest actually paid and the interest paid after the FISIM allocation. The net impact of FISIM on the net interest income of households and thus on household net property income is then the sum of FISIM on deposits and loans. The latest observation is for the second quarter of 2023.
Household disposable income also includes imputed rents, which affect household gross operating surplus. The gross operating surplus of households as recorded in the national accounts measures the output of housing services for households’ own consumption less the intermediate consumption required to produce this output (e.g. FISIM on mortgage loans) and taxes. The output of housing services for households’ own consumption is the imputed rents that households would have received if they had rented out their owner-occupied dwelling.[10]
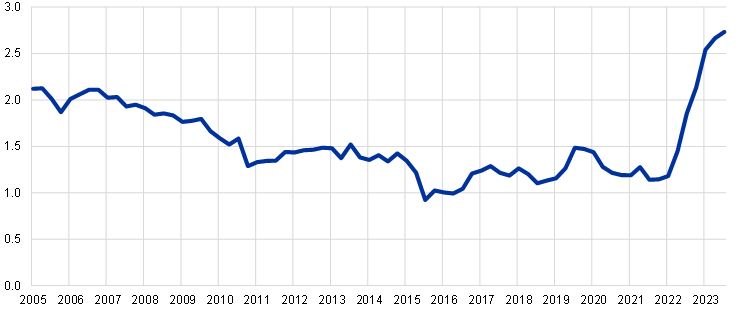
The exceptionally strong increase in the gross operating surplus in the first half of 2023 is attributable to both higher imputed rents and lower FISIM for mortgage loans. Imputed rents are likely to have been positively affected by the increase in rent inflation, which, according to the rent price index that, for the purposes of the Harmonised Index of Consumer Prices, measures rents actually paid by tenants, rose from an average of 2% in the second half of 2022 to 2.6% in the first half of 2023, reaching historically high levels (Chart D). At the same time, FISIM on mortgage loans is likely to have declined considerably in parallel with the decline in FISIM on total loans in the first half of 2023 (Chart C). Both factors, i.e. the increase in imputed rents and the decrease in FISIM on mortgage loans, can explain the significant increase in households’ gross operating surplus in the first half of 2023.[11]
Chart D
Rent inflation
(annual percentage changes; quarterly averages)
Sources: Eurostat and ECB calculations.
Note: The latest observation is for the third quarter of 2023 and refers to October 2023.
The muted outlook for private consumption appears to be in line with the negative assessment by consumers of recent developments in real income. Although FISIM and imputed rents are added to household disposable income in the national accounts, they do not contribute to households’ cash flow and may therefore not be taken into account in households’ perceptions of income. As such, these sources of income are unlikely to play a major role in developments in private consumption.[12] One indicator of the growth in household income that should come closer to what households actually perceive as income is labour income. Indeed, the deflation of compensation of employees and compensation per employee with the private consumption price deflator suggests that real income growth, as it is most likely perceived by households, was weaker than real disposable income growth as measured in the national accounts (Chart E). This, in turn, is in line with the pessimistic assessment by consumers of recent developments in real income according to surveys (as shown in Chart A) and thus the subdued outlook for private consumption.[13]
Chart E
Developments in real household income
(annual percentage changes)
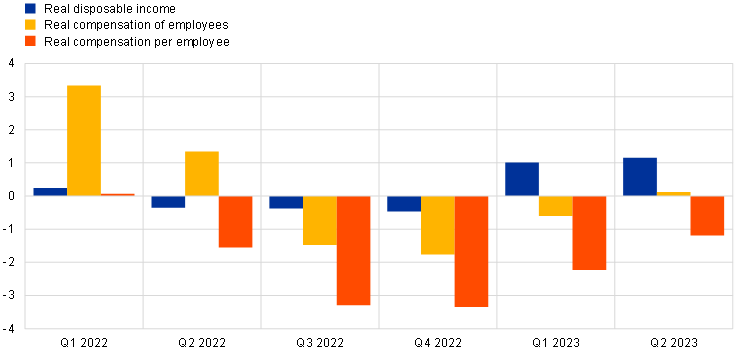
Sources: Eurostat and ECB calculations.
Note: Developments in real income are derived by using the private consumption price deflator to deflate nominal income.
While the percentage of low-income households reporting a decline in their income is higher than for households in other income brackets, the percentage of respondents reporting an increase in their real income is relatively low and stable across the income distribution.
Specifically, disposable income of households is measured in official statistics in the so-called sector accounts, which contain detailed national accounts data broken down by institutional sector, including households and non-profit institutions serving households, general government, and financial and non-financial corporations. In this box, the term “national accounts” is used when referring to official data on disposable income.
This negative impact of net fiscal income in the first half of 2022 was related to the reversal of the coronavirus (COVID-19) support measures, which had been negatively affecting annual growth of household disposable income since the second quarter of 2021.
Mixed income relates closely to income from self-employment, measuring the surplus (or deficit) accruing from production by unincorporated enterprises owned by households. Property income corresponds to income arising from the ownership of financial assets or tangible, non-produced assets (in particular, land is a tangible, non-produced asset, so that rents from land form part of property income, while rents from housing, which is a tangible, produced asset, form part of mixed income). Gross operating surplus is primarily an imputed flow as it mainly contains imputed rents, which are the income that owner-occupier households would have received if they had rented out their dwelling.
Financial intermediation services indirectly measured (FISIM) is used in the national accounts to compute the value added of financial intermediaries (e.g. banks) for financial services provided without explicit service charges. Net property income excluding FISIM is therefore determined, among other things, by households’ actual net interest income in addition to the distributed income from corporations (i.e. dividends). For a discussion of recent developments in the net interest income of households and corporations in the euro area, see the box entitled “Net interest income of households and corporations” in this issue of the Economic Bulletin. For a discussion of euro area corporate profit developments as perceived by companies, see the box entitled “Earnings calls: new evidence on corporate profits, investment and financing conditions”, Economic Bulletin, Issue 4, ECB, 2023.
For a discussion of the reconciliation of national accounts data on income with survey data in the context of the EU statistics on income and living conditions (EU-SILC), see Törmälehto, V., “Reconciliation of EU statistics on income and living conditions (EU-SILC) data and national accounts”, Statistical working papers, Eurostat, 2019.
For the concept of FISIM and its treatment in the national accounts, see Chapter 14 of the European System of Accounts (ESA 2010) manual.
This is the rate at which it is assumed that both the household as lender and the household as borrower would be willing to conclude a transaction.
For an assessment of the impact of FISIM in the case of France with a focus on consumer prices, see INSEE, “Economic Outlook - Cooling”, Conjoncture in France, December 2022.
The inclusion of imputed rents in the national accounts is important in order to achieve full coverage of real estate activities (renters and owner-occupiers). By doing so, the international comparability of GDP and national income is ensured, as home ownership rates may differ significantly across countries. However, as imputed rents cannot be observed, an estimate must be made.
The fact that FISIM on mortgage loans is added to household disposable income via net property income and deducted from household income via gross operating surplus (and via mixed income for households that are actually landlords) means that it has no effect on household disposable income, so that the overall effect of FISIM on household disposable income is effectively determined by FISIM on deposits and on consumer loans. This impact does not correspond to the FISIM reported in Chart B and Chart C, which show the impact of FISIM on the net property income of households for which official data are available.
This is in line with the finding that the propensity to consume appears to be highest for the most liquid income items (such as labour income), and vice versa. See de Bondt, G., Gieseck, A., Herrero, P. and Zekaite, Z., “Disaggregate income and wealth effects in the largest euro area countries”, Working Paper Series, No 2343, ECB, December 2019.
For an assessment of the outlook for private consumption, see the section on economic activity developments in this issue of the Economic Bulletin.