


Published as part of the ECB Economic Bulletin, Issue 7/2023.
The rent component is typically not a prominent driver of developments in euro area HICP, with an average contribution of 0.1 percentage points since 1999. Looking at the period since mid-2022, there has been a notable pick-up in the annual growth rate of euro area actual rental prices for housing, though more muted than the rise in other services prices. Questions on the inflationary impact of rents are largely inspired by developments in the United States, where rent inflation has been a key driver of the post-pandemic inflation surge. When assessing the scope for rents to play a similarly important role in euro area inflation dynamics, measurement issues need to be taken into account, as do the various methodological and regulatory specificities surrounding this particular HICP component.
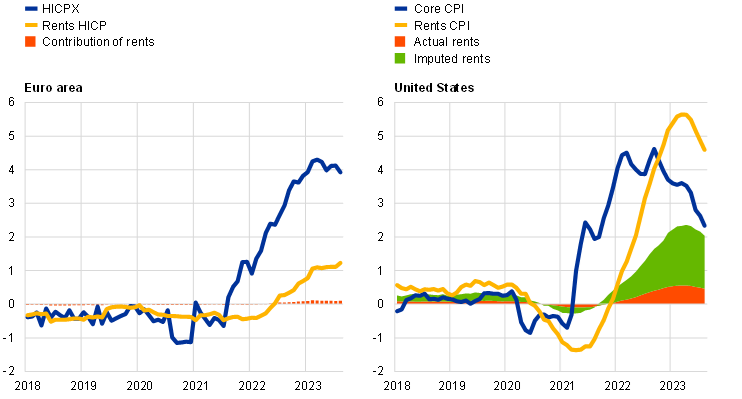
The limited contribution of rent growth to core inflation in the euro area reflects both moderate dynamics and a comparatively small weight. In August 2023 actual rent inflation was 2.8% in annual terms. This was the highest reading since the launch of the euro and 1.2 percentage points above its long-term average in the period 2000-19. Its contribution to euro area HICP inflation excluding energy and food (HICPX) was 0.24 percentage points, 0.1 percentage point above its long-term average (Chart A, panel a). This relatively low contribution of rents to euro area inflation contrasts with the United States. There, the contribution of actual rents to the core Consumer Price Index (CPI) reading was about three times higher in August 2023, at 0.7 percentage points, some 0.5 percentage points above its 2000-19 average. The high contribution of rising rents to core inflation in the United States partly reflects the unwinding of a federal eviction moratorium. This policy was implemented in 2020 in response to the coronavirus (COVID-19) pandemic and led to much lower growth in US rents. After the moratorium was lifted in late 2021, US rent inflation surged, reaching 8.8% in March 2023. It had moderated only slightly to 7.8% by August, remaining significantly above its long-term average of about 3%.
Rents for new contracts, which should respond faster to market forces, also show sluggish rent growth in the euro area. Data on new rents in the euro area are scarce. Evidence from annual data in Germany – used for illustrative purposes (Chart A, panel b) – shows that rent developments for new lettings are indeed more dynamic than those for existing rents, especially during upturns in the housing market.[1] Yet, as compared with the US housing market, rents in the euro area appear less sensitive to market forces – including house prices.[2] The magnitude and volatility of developments in new rents in the United States are much more pronounced and closely follow overall housing market developments. This reflects the low level of rent regulation in the United States. Only a few US states regulate rents, whereas such measures are much more common in the euro area.
Chart A
Rent developments in the euro area, the United States and Germany
a) Inflation, rents and contributions
(annual percentage changes, percentage point contributions, both relative to 2000-19 averages)
b) Rents for existing and new contracts
(annual percentage changes)
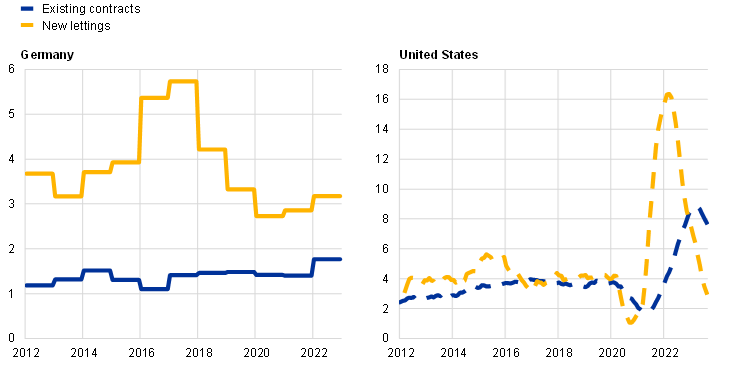
Sources: Eurostat, US Bureau of Labor Statistics, Deutsche Bundesbank and ECB staff calculations.
Notes: Panel a: the latest data for the HICP and CPI are for August 2023. Panel b: for Germany, the existing contracts data use Deutsche Bundesbank calculations based on data provided by the German Federal Statistical Office (Statistisches Bundesamt – Destatis), to an extent including new lettings. For Germany, the new lettings are transaction-weighted Deutsche Bundesbank calculations based on data provided by bulwiengesa AG. US existing contracts are based on the monthly Zillow observed rent index (seasonally adjusted). Data for Germany refer to 2022. Data for US CPI and existing rents refer to August 2023.
In the United States, the greater contribution of rents to inflationary developments also reflects the higher weight of rents in the CPI and the broader scope of the definition of “shelter”. Rents account for less than 6% of the total euro area HICP, which is only slightly below their weight of 7.5% in the US CPI.[3] [4]In the United States, however, the total shelter component also includes imputed rents of owner-occupiers, as well as lodging away from home. As a result, the shelter component accounts for 35% of the CPI. This is about six times the weight of rents in the euro area. The imputed rent is the implicit rent that owner-occupiers would have to pay if they were renting their homes. In the euro area, the HICP basket does not include imputed rents, but only actual expenditures on rents – together with additional housing costs paid by both tenants and owners. Home ownership is similar in both jurisdictions at around 65%.[5]
Rent regulation in the euro area is generally more widespread than in the United States (Chart B) and has increased since the pandemic. This has tended to diminish the responsiveness of rents to underlying variables such as house prices, construction/renovation costs and inflation. Moreover, in some countries, social rental housing plays an important role. Rents for such homes are usually lower than the market rent, with changes in the level often highly regulated. Among the five largest euro area economies, the Netherlands has the largest share of rental contracts at reduced prices (85%).[6] France also has a large share of contracts at reduced prices. While available rent control indices only provide data up to 2019, several countries, including France and Spain among the largest countries, recently introduced measures to cap price increases in a high-inflation environment (see Table A, column 4 for a list of these features in the largest euro area economies).[7] Once such measures are phased out, rents could rise. In addition, in 2020 some countries introduced support measures in the private rental market in response to the pandemic, ranging from moratoria on evictions to the extension of rental contracts.
Chart B
Rent control index
(index)
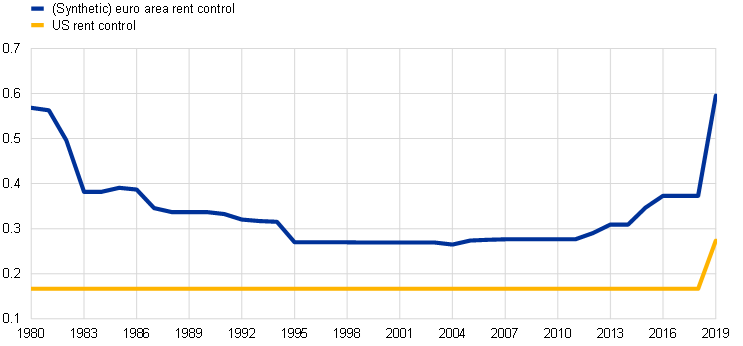
Sources: 2019 OECD Questionnaire on Affordable and Social Housing, Rental Market Regulation Index (ReMaIn) and own calculations.
Notes: The index ranges from 0 (no restrictions) to 1. A higher value of the index indicates greater rent control.
Changes in rents over time are affected by several methodological and regulatory aspects that make them less sensitive to market forces than other HICP components. First, rents tend to be adjusted less often than other prices – in general not more than once a year. Second, contracts are typically renewed sluggishly and with a backward-looking perspective, which contributes to rental price growth being particularly slow-moving. From a methodological point of view, the frequency of rent data collection varies across countries. Prices are sampled monthly in most cases, but once per year in the Netherlands for instance (Table A). Additionally, as discussed above, the rent basket mostly covers existing rents, which tend to catch up with market forces with a lag. Rents for temporary accommodation would be a good indication of market pressures, but these are included in the HICP accommodation services component and not in rents.
Table A
Rental market characteristics in the largest euro area economies
Data source | Frequency of price collection | Latest regulations in place related to “high cost of living” | Index of rent control1) | Share of overall rental market at reduced price or free2) | |
|---|---|---|---|---|---|
DE | Survey starting from the latest census data on dwellings | Quarterly3) | n/a | 0.75 | 12.6 |
FR | Survey starting from the census data on dwellings (free market) or from the directory of rental housing in the social sector (social housing) | Quarterly | Rent increases capped at 3.5% until March 2024 | 0.53 | 57.1 |
IT | Administrative data from the Real Estate Market Observatory of the Tax Office | Quarterly4) | No | n/a | 35.4 |
ES | In-person or phone survey | Monthly | Rent increases capped at 2% until December 2023 | 0.57 | 35.4 |
NL | Landlords | Yearly | No | 0.47 | 86.4 |
Sources: Eurostat, OECD and ECB staff calculations.
1) The rent control index ranges from 0 (no restrictions) to 1 (all types of restrictions) according to answers to the 2019 OECD Questionnaire on Affordable and Social Housing.
2) Refers to 2022 data from the EU statistics on income and living conditions (EU-SILC).
3) In Germany, collection of monthly rents is carried out quarterly, for three months in advance.
4) In Italy, monthly data collection started regularly from the beginning of 2023 in parallel with quarterly collection, with a plan to switch to the monthly data source in the near future.
Some indexation to inflation is present, but such clauses are not widespread across all private market rental contracts and jurisdictions. In Italy, for example, only certain types of contract are linked to inflation. In Belgium, a health index derived from the national CPI (excluding tobacco, alcohol and fuel products) is used for the indexation of existing contracts. However, the indexation of rental contracts is not possible for properties with a low degree of energy efficiency. In France and Spain, rent increases through indexation have recently been capped at 3.5% and 2% respectively. In Germany, rents are generally linked to a reference rent for similar-quality dwellings in the same locality, established at regular intervals (usually every four to six years). This makes the adjustments generally quite sluggish. However, some indexation also exists in Germany and is triggered by certain thresholds for CPI changes being crossed. Recent increases in inflation are likely to result in a higher share of contracts reaching these thresholds.
The recent growth in euro area rents is somewhat stronger than implied by a model using historical regularities. A single-equation model accounting for the strong inertia in rent inflation, including the link with past inflation and the residential investment deflator, would have captured the upward trend in rent inflation after end-2021 but underestimated its speed and strength (Chart C).[8] Looking ahead, there are two challenges to forecasting euro area rents: first, the sharp increase in inflation in the latter part of the estimation sample, and second, the possibility that euro area countries will limit the pass-through to rents to preserve housing affordability. More generally, rent regulation in a broader sense is not included in the explanatory variables of reduced-form models such as the one considered here. Such regulation may therefore lead to overprediction of rent developments going forward.
Chart C
Euro area projected and actual rent growth
(annual percentage changes)
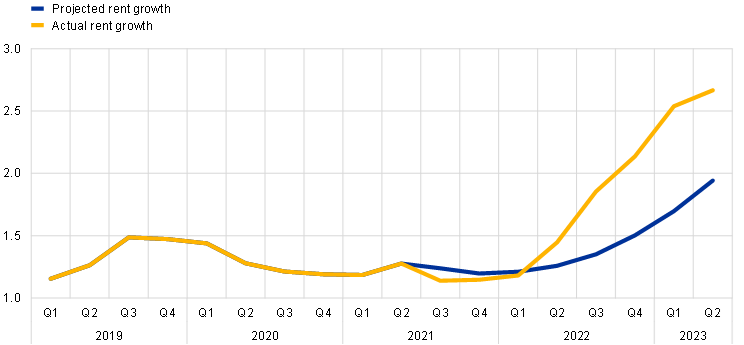
Sources: Eurostat and ECB staff calculations.
Notes: See footnote 8 for a description of the model. The model is estimated for the period from the first quarter of 1999 to the second quarter of 2021. Rent projections start in the third quarter of 2021. The latest observations are for the second quarter of 2023.
Although rent inflation varies greatly across euro area countries, the latest readings for most countries are higher than one year ago and exceed long-term averages (Chart D). Idiosyncratic national characteristics of the housing markets across euro area countries account for the large diversity observed in rent inflation. Annual changes ranged from 18.3% in Malta to -2.0% in Estonia in August 2023 (Chart D, panel b). Such idiosyncrasies relate among other things to national regulation, different statistical recording and sampling, the indexation of rental contracts to inflation (see above), the size and depth of the private rental market compared with the share at a reduced price or free, and the size of the overall rental market, which differs substantially across euro area countries.
Chart D
Rent developments across the euro area
(annual percentage changes, averages)
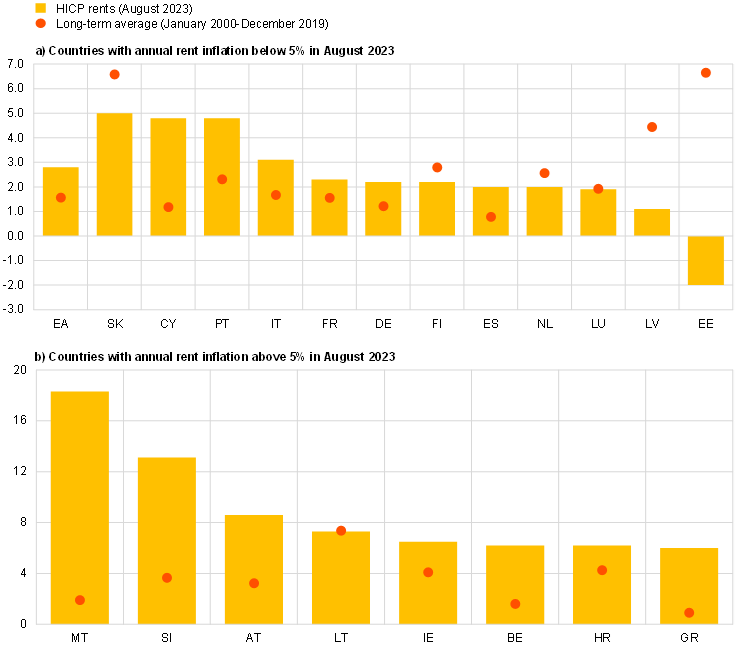
Sources: Eurostat and ECB staff calculations.
Notes: For Spain, the long-term average starts in January 2016 due to methodological changes in the data collection. EA stands for euro area.
Upward pressures on rent inflation are likely to persist, although some institutional features may act as mitigating factors. Upward pressures are particularly strong at present and relate to both supply and demand for housing. Higher construction costs as well as higher costs for the maintenance and repair of dwellings are contributing to a reduction in the profitability of property ownership in real terms. Meanwhile, tighter financing conditions are limiting the supply of housing.[9] In some countries, additional pressures exist due to both an increasing number of rental units being used for short-term tourist rentals and strong inflows of foreign workers. On the demand side, past increases in house prices, coupled with increasing financing costs, have reduced housing affordability. This tends to lead to rented accommodation being preferred to home ownership. Despite such upward pressures, the strong inertia embedded in rental prices – partly for institutional reasons – implies a relatively slow adjustment in rents. This would suggest that any risk of pressure on underlying inflation emanating from the euro area rental markets is relatively limited. Nonetheless, the situation is country-specific, due to the major idiosyncrasies in the respective housing and rental markets.
Existing estimates for Germany suggested that 10% of households move every year, which would mean that each year approximately 10% of rental prices should consist of new contracts, without considering increases in demand related to population growth.
The theoretical long-term relationship between house prices and rents is difficult to observe in the euro area data. For a discussion, see the box entitled “Rent inflation in the euro area since the crisis”, Economic Bulletin, Issue 4, ECB, 2019.
The weight of rents in the HICP varies considerably across countries, ranging from 9% in Finland to 0.7% in Slovenia, reflecting the different dimensions of the respective rental markets.
The rent measure in the US Consumer Price Index is based on contract rents and also includes any additional services that might be provided by the landlord under the rental contract (e.g. utilities). In the euro area, actual rents in the HICP only refer to payments related to actual rents.
The European Statistical System has yet to reach agreement on a satisfactory methodology for including housing costs for homeowners in the HICP. For a discussion, see “Owner-occupied housing and the harmonised index of consumer prices”, Statistical Working Papers, Eurostat, 2023. A preliminary estimate of the impact of adding imputed rents to the HICP would yield an average fairly similar to official headline inflation for the period until mid-2021; see Chart 8 in “Inflation measurement and its assessment in the ECB’s monetary policy strategy review”, Occasional Paper Series, No 265, ECB, 2021.
This share increased significantly from 2021 due to regulatory changes, while the average share in the period 2013-20 was only 2.2%.
The rent control index summarises the extent of restrictions on setting the initial rent level, updating it and passing costs (such as renovation) on to tenants.
A real-time forecast evaluation exercise indicates that a single-equation model slightly outperforms a random walk up to six quarters ahead and also outperforms a Bayesian vector autoregression (BVAR) including additional housing market-related variables. The single equation selected includes lagged rent (with a one-quarter lag) and inflation, as well as the residential investment deflator (with four-quarter lags). The addition of house prices worsened the performance of the models. The variables selected are widely used in the literature on rent projections; see, for example, Appendix 2 in John Muellbauer’s contribution to the 2022 ECB Forum on Central Banking, “Real Estate Booms and Busts: Implications for Monetary and Macroprudential Policy in Europe”, ECB, June 2022.
Costs for services and repair of the dwelling increased by 6.8% in annual terms in August 2023, while costs related to major repair and maintenance for owners increased by 9.9% in annual terms in the first quarter of 2023.