


The drivers of recent developments in business activity expectations across sectors
Published as part of the ECB Economic Bulletin, Issue 7/2023.
Business activity expectations have deteriorated since mid-2022, with the decline occurring earlier than the weakening of economic growth in the euro area. According to the European Commission’s business survey, near-term expectations for business activity have declined in year-on-year terms since the third quarter of 2022. This deterioration has foreshadowed the subsequent slowdown in euro area economic activity, although the pace of the slowdown has differed across sectors. This box analyses a new bottom-up composite index of business activity expectations across sectors. It also assesses the role played by the structural drivers of the index using disaggregated data on expectations and limits to production from the European Commission’s business survey.
The bottom-up composite index of business activity expectations is a good leading indicator of real GDP. This index is calculated as the weighted average of the balance of responses to the survey on near-term expectations for activity in three main sectors: three-month-ahead production expectations for manufacturing, three-month-ahead demand expectations for services and an assessment of order books for construction.[1] The composite index, measured in the first month of each quarter, correlates strongly with the year-on-year growth rate of real GDP in the same quarter, similarly to broader indices such as the European Commission’s Economic Sentiment Indicator and S&P Global’s Purchasing Manager Index composite output (Table A).[2] At sector level, each component also correlates strongly with sector value added data, and the correlations are similar to those shown in Table A.
Table A
Historical correlations between survey indicators and real GDP growth
Correlation coefficient | Business activity expectations | Economic Sentiment Indicator | Purchasing Manager Index |
|---|---|---|---|
From the first quarter of 1999 to the second quarter of 2023 | 0.76 | 0.79 | 0.76 |
From the first quarter of 1999 to the fourth quarter of 2019 | 0.87 | 0.91 | 0.86 |
Sources: European Commission (DG-ECFIN), S&P Global and ECB calculations.
Notes: The correlation is calculated between the survey indicators at standardised levels in the first month of each quarter and the year-on-year real GDP growth rates for the same quarter. On a related point, not shown in the table, note that the correlation between the year-on-year change in the standardised survey indicators and the year-on-year real GDP growth rate is somewhat lower over the pre-pandemic sample. However, it has increased since the start of the pandemic, providing a relatively good reflection of the year-on-year real GDP growth dynamics in the post-pandemic recovery.
An empirical model is used to assess the impact of structural drivers on business activity expectations. A Bayesian structural vector autoregression (BSVAR) model is estimated for each sector and then aggregated to quantify the impact of the structural drivers of the composite index. The model includes measures of firms’ expectations for activity and prices, as well as perceptions about which factors limit production – product demand, financial conditions, labour force shortages, shortages of materials and/or equipment, and/or other factors (related, for instance, to regulatory or – more recently – pandemic developments). It uses sign and magnitude restrictions to identify three demand shocks (product demand, financial conditions and other demand) and three supply shocks (labour, materials and other supply).[3]
The model shows that recent trends in business activity expectations were driven by deteriorating demand, partly offset by recovering supply. Business expectations dipped during the global financial crisis and the euro area sovereign debt crisis, mainly driven by demand factors (Chart A, panel a). More recently, they dropped in 2020 due to the outbreak of the pandemic but recovered in 2021 as the economy reopened (Chart A, panel b). In this instance too, it was mainly demand forces that drove expectations, with supply factors also playing an important role. However, according to the model, business expectations weakened at the end of 2022, mainly as a result of supply-side forces. This drop in expectations foreshadowed the recent moderation in real GDP growth momentum. In the year up to the third quarter of 2023, business expectations were hampered by subdued demand, partly offset by favourable supply. The results generated using this model attribute more importance to demand factors than other studies, which find that supply factors played a stronger role in driving business activity, especially in the wake of the pandemic in 2020. This may reflect different modelling assumptions, the forward-looking nature of expectations-based indicators or the fact that other studies looked at the aggregate economy, which is broader than the sectors covered in this box.[4]
Chart A
Historical drivers of business activity expectations
(year-on-year changes, percentage point contributions, standardised balances)
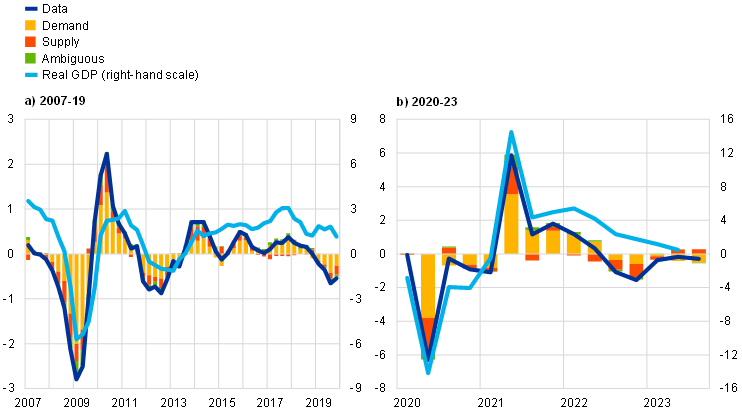
Sources: European Commission (DG-ECFIN) and ECB calculations.
Notes: The composite indicator for activity expectations is calculated as the weighted average of the indices for three-month-ahead production and demand expectations for manufacturing and services respectively and the assessment of order books for construction. The BSVAR model is estimated with prior selection, COVID-19 heteroskedasticity adjustment and sign and magnitude restrictions. The sample is based on euro area data from the first quarter of 1999 to the third quarter of 2023. The latest observations are for the third quarter of 2023.
The granular model-based decomposition suggests that tightening financial conditions and flagging product demand were the main drag on business activity expectations in the third quarter of 2023. In year-on-year terms, in the third quarter of 2023 business expectations for manufacturing and construction deteriorated more sharply than those for services. This was mainly due to worsening financial conditions, which affected all three sectors (Chart B). Expectations were also hit by adverse product demand, partly due to continued destocking by industries. However, they were supported by a recovery in supply (of materials in particular) in manufacturing and construction. They also benefited from favourable labour supply and other supply factors linked to persistent reopening effects in the services sector.[5]
Chart B
Drivers of business activity expectations by sector and breakdown of shocks in the third quarter of 2023
(year-on-year changes, percentage point contributions, standardised balances)
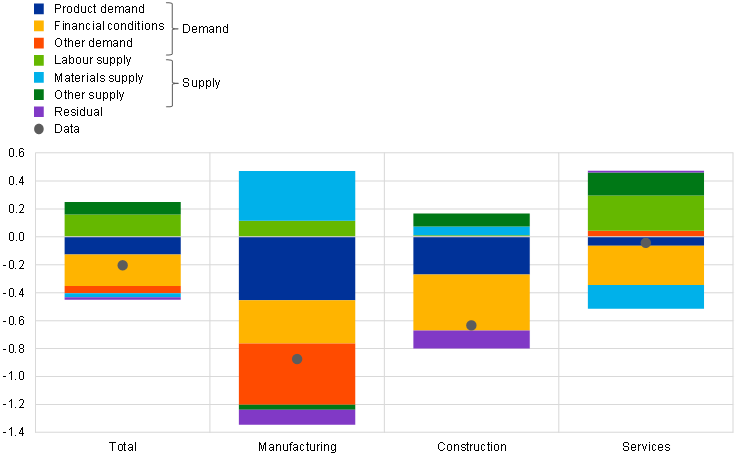
Sources: European Commission (DG-ECFIN) and ECB calculations.
Notes: The composite indicator for activity expectations is calculated as the weighted average of the indices for three-month-ahead production and demand expectations for manufacturing and services respectively and the assessment of order books for construction. The BSVAR model is estimated with prior selection, COVID-19 heteroskedasticity adjustment and sign and magnitude restrictions. The sample is based on euro area data from the first quarter of 1999 to the third quarter of 2023.
A deeper analysis across subsectors provides more detailed insights into cross-sector developments. Chart C shows an overview of the model-based decomposition across the main industrial groups and consumer services, estimated separately from the bottom-up aggregation of the composite index, for the third quarter of 2023. All manufacturing groups were affected by tightening financing conditions, whereas low product demand mainly affected intermediate and capital goods (more closely linked to investment) rather than consumer goods (more closely linked to final household consumption).[6] The capital goods subsector was affected by other demand factors, possibly relating to hurdles linked to the green transition in the automotive sector.[7] Consumer services benefited from positive labour supply effects, mainly in accommodation, while they suffered delayed adverse effects from the weak supply of materials, mainly in travel.
Chart C
Drivers of business activity expectations by subsector and breakdown of shocks in the third quarter of 2023
(year-on-year changes, percentage point contributions, standardised balances)
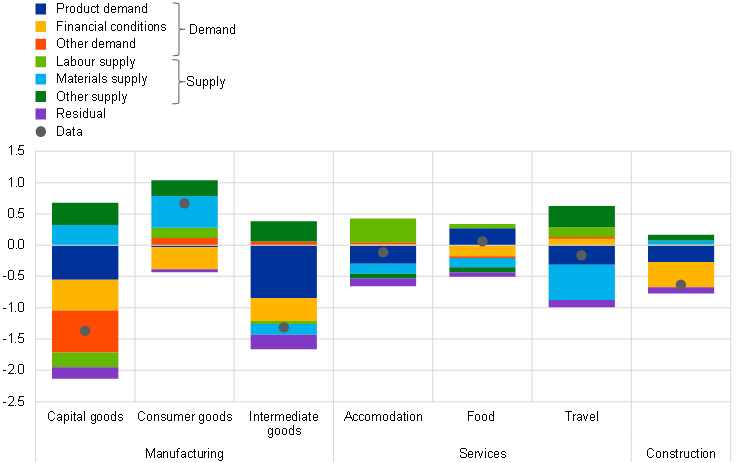
Sources: European Commission (DG-ECFIN) and ECB calculations.
Notes: The composite indicator for activity expectations is calculated as the weighted average of the indices for three-month-ahead production and demand expectations for manufacturing and services respectively and the assessment of order books for construction. The BSVAR model is estimated with prior selection, COVID-19 heteroskedasticity adjustment and sign and magnitude restrictions. The sample is based on euro area data from the first quarter of 1999 to the third quarter of 2023.
All in all, the model provides an assessment of the factors driving business activity expectations across sectors and the implied path of real GDP growth in the euro area. While improving supply forces should support activity, worsening financial conditions and decreasing demand across industries cloud the manufacturing outlook for the third quarter of 2023. Looking ahead, despite more resilient expectations for services, the gradual decline of favourable reopening effects and the increasing adverse impact of tightening financial conditions are tilting expectations downwards.
The weights are based on sector shares in total gross value added after excluding non-market services activities (included in the NACE Rev. 2 classification as O, P and Q, and corresponding to public administration, defence, education, human health, and social work activities). After being rescaled, the weights correspond to around 22% for manufacturing, 7% for construction and 71% for services.
Overall, sentiment and survey-based indices are known for having good correlations with hard data on year-on-year growth rates. See, for instance, the evidence reported by Camacho, M. and Perez-Quiros, G., “Introducing the euro-sting: Short-term indicator of euro area growth”, Journal of Applied Econometrics, Vol. 25, Issue 4, pp. 663-694, May 2010.
All variables are first standardised and then differenced. With regard to the structural shocks, product demand, financial conditions and other demand shocks, which are included in aggregate demand, raise activity and prices. Labour, materials and other supply shocks, which are part of aggregate supply, raise activity but reduce prices. Each shock induces the largest reduction in its factor-specific limit. The BSVAR model is estimated with prior selection, COVID-19 heteroskedasticity adjustment and sign and magnitude restrictions. For details on prior selection, see Giannone, D., Lenza, M. and Primiceri, G.E., “Prior Selection for Vector Autoregressions”, The Review of Economics and Statistics; Vol. 97, Issue 2, 2015, pp. 436-451. For details on COVID-19 heteroskedasticity adjustment, see Lenza, M. and Primiceri, G.E., “How to estimate a vector autoregression after March 2020”, Journal of Applied Econometrics, Vol. 37, Issue 4, June/July 2022, pp. 688-699.
These reasons – together with differences in the number of variables, the number of restricted shocks, the sample considered and the statistical treatment of the COVID-19 period – explain the difference compared with, for instance, the results presented in the box entitled “A model-based assessment of the drivers of economic activity” in the article entitled “The role of supply and demand in the post-pandemic recovery in the euro area”, Economic Bulletin, Issue 4, ECB, 2023, and the box entitled “Supply chain disruptions and the effects on the global economy”, Economic Bulletin, Issue 8, ECB, 2021. However, the results in this box are in line with those presented in studies based on forward-looking data from the European Commission’s consumer survey, such as those in the article entitled “Energy prices and private consumption: what are the channels?”, Economic Bulletin, Issue 3, 2022.
These results are in line with the main findings from the ECB’s recent contacts with non-financial corporations.
In line with the findings from the model, the main findings from the ECB’s recent contacts with non-financial corporations show that intermediate goods producers have particularly suffered from decreasing demand since the start of 2023, owing to continued destocking over the supply chain.
A model decomposition for the automotive sector shows that the sector has been affected by other demand shocks, which preceded the outbreak of the pandemic and have become predominant since the start of 2023. A deeper analysis on the automotive industry is available in the box entitled “Motor vehicle sector: explaining the drop in output and the rise in prices”, Economic Bulletin, Issue 7, ECB, 2022.