


Selling price expectations of firms ‒ evidence from the SAFE
Published as part of the ECB Economic Bulletin, Issue 4/2023.
This box explores the selling price expectations of firms for the period April 2023-April 2024, focusing on the heterogeneity across the retail and non-retail sectors. The latest Survey on the Access to Finance of Enterprises (SAFE), which was conducted between 6 March and 14 April 2023, included two ad hoc questions on firms’ subjective expectations about changes in (i) their selling prices, and (ii) their current employees’ wages over the next 12 months.[1] This box focuses on firms’ expectations about their selling prices only. As the SAFE includes firms that sell to both other firms and consumers, their average expectations about future selling prices represent a mix of producer and consumer prices. Firms have therefore been grouped into two broad sectors, retail and non-retail sector firms, in accordance with their NACE industry classification.[2] This is to distinguish between firms selling intermediate and final goods and services to other firms and those selling directly to final consumers.[3]
On average, euro area firms expect their selling prices to rise by 6.1% over the next 12 months, with higher increases in the retail sector (Chart A).[4] Based on the NACE classification, firms in the retail sector and other sectors that predominantly sell to final consumers on average reported significantly higher expected selling prices (6.8%) over the next 12 months, compared with firms in the non-retail industries (4.9%), as well as a less dispersed distribution.
Chart A
Changes in the average expected selling price over the next 12 months
(percentages)
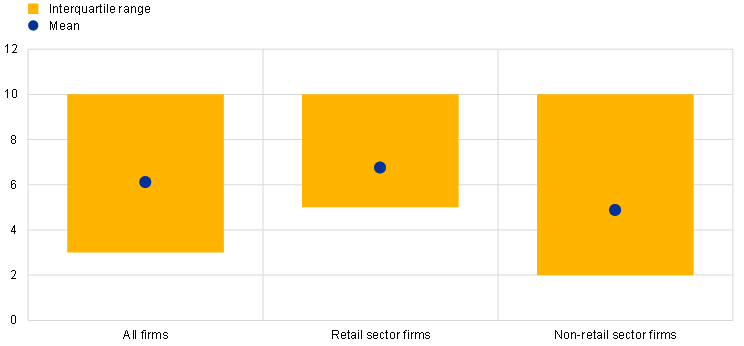
Sources: ECB and European Commission SAFE.
Notes: Average expectations about selling prices for the next 12 months as reported by euro area firms, along with interquartile ranges, using survey weights. The statistics are computed after trimming the data at the country-specific 1st and 99th percentiles. The distribution for “All firms” comprises the replies of all enterprises included in the SAFE (10,983). See the relevant footnote for details on the categorisation of firms as “retail sector” and “non-retail sector” firms. The change in the average expected selling price for the subsample of retail and non-retail sector firms merged with Bureau Van Dijk’s Orbis dataset is 5.6%. The figures refer to the 28th round of the SAFE (October 2022-March 2023).
Firms that have reported recent increases in input and financing costs expect higher selling prices (Chart B). Firms included in the SAFE report on whether their labour costs, other input costs (mainly related to materials and energy) and bank borrowing costs have increased, stayed the same or decreased over the past six months. Reduced-form regressions considering the joint impact of such production and financing costs suggest that firms which reported an increase in costs related to materials and energy in the period from October 2022 to March 2023 expect their selling prices to increase over the next 12 months by around 2 percentage points more than those of firms reporting unchanged or decreasing non-labour input costs. Past reported increases in the cost of energy and materials are relevant for future selling prices for both retail and non-retail firms, but the effect is larger for non-retail firms. One explanation could be that non-retail firms are mostly in the manufacturing sector, where energy and other input costs represent a higher share of total costs than in retail. Additionally, firms in the non-retail sector that have reported past increases in labour costs and interest rate expenses expect their selling prices to increase over the next year. The reduced-form estimates for the impact of interest rates are consistent with the emergence of a cost channel of monetary transmission through which changes in interest rates affect price-setting behaviour and inflation developments by raising real marginal costs.[5] At the same time, this reduced-form, firm-level regression falls short of capturing the overall dampening impact of higher interest rates on inflation via a traditional aggregate demand channel of monetary transmission.
Chart B
Expected selling prices and past production and financing costs
(percentage points)
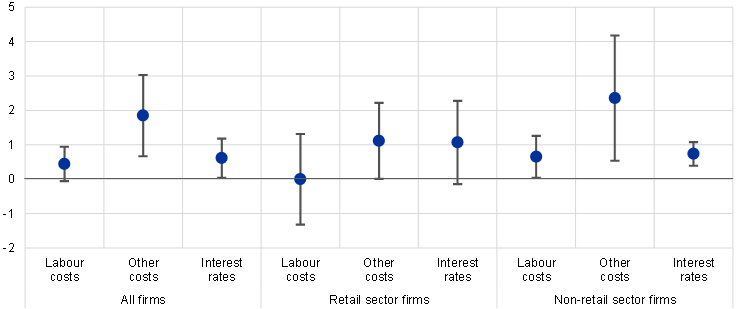
Sources: ECB and European Commission SAFE and ECB calculations.
Notes: The chart shows coefficients from regressing the change in expected prices on changes in labour costs, other costs (materials and energy) and the level of interest rates. The right-hand side variables in the regression take value 1 if firms indicated an increase in labour costs, other costs or the level of interest rates for the period October 2022-March 2023. The regressions include country and firm-size fixed effects. The whiskers represent 90% confidence intervals based on clustered standard errors by country. See the relevant footnote for details on the categories “All firms”, “Retail sector firms” and “Non-retail sector firms”. The figures refer to the 28th round of the SAFE (October 2022-March 2023).
Expected increases in selling prices are higher for firms that expect an increase in their turnover in both the retail and non-retail sectors (Chart C). In their responses to the SAFE, firms also report on whether their turnover and profits over the past six months and their expected turnover over the next six months have increased, stayed the same or decreased. For all firms in the sample and in the breakdowns of firms by sector, past increases in turnover and profits are not associated with firms reporting a significant difference in expected selling prices. Firms in both the retail and non-retail sectors signalled significantly higher expected selling prices if they also reported higher expected turnover over the next six months. This could reflect that firms expecting increased demand for their products and services after the reopening of the economy are more likely to raise prices going forward. The expected future increase in selling prices and turnover could also be driven by higher than expected input costs.
Chart C
Expectations of selling prices by turnover and profits
(percentages)
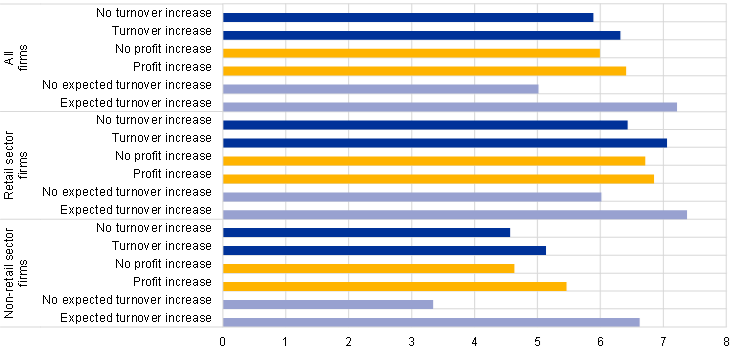
Sources: ECB and European Commission SAFE.
Notes: Average expectations about selling prices for the next 12 months as reported by euro area firms for firms reporting an increase in their turnover/profits or decrease/no change in their turnover/profits over the past six months and firms reporting and increase or decrease/no change in expected turnover over the next six months, using survey weights. Average expectations about selling prices are computed after trimming the data at the country-specific 1st and 99th percentiles. The distribution for “‘All firms” comprises the replies of all enterprises in the survey (10,983). See the relevant footnote for details on the categorisation of firms as “Retail sector” and “Non-retail sector” firms. The figures refer to the 28th round of the SAFE (October 2022-March 2023).
Manufacturing firms in industries and countries that reported higher past increases in producer prices expect a smaller increase in selling prices over the next 12 months (Chart D). Firms in the manufacturing sector (for which producer price data are available at country-industry level) show significant heterogeneity in their expected selling prices. Those firms for which above-median producer price increases were reported in the third quarter of 2022 expect an increase of around 3.4% (for the third quartile of the distribution of producer price inflation) and 2% (for the fourth quartile), which is well below the average expected selling price.[6] Firms in industries which reported below-median producer price increases in the past expect higher selling prices over the next year (by around 5.5%). As manufacturing sectors sell mainly intermediate inputs to other sectors, this heterogeneity could help us understand the pass-through of producer prices to consumer prices.[7] The observed price-setting behaviour may be consistent with state-dependent pricing models where the probability of price adjustments increases with price misalignments.[8]
Chart D
Expectations of selling prices by quartiles of past producer price increases
(percentages)
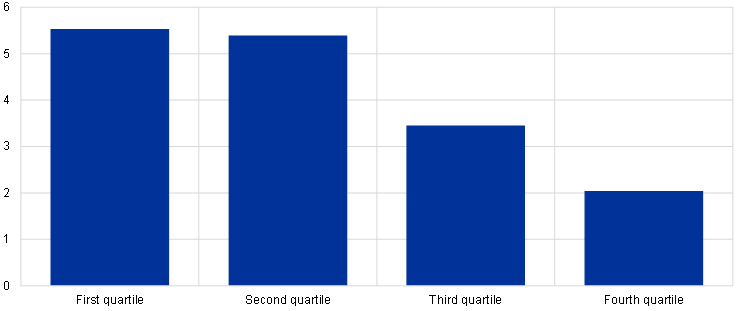
Sources: ECB and European Commission SAFE, Eurostat and ECB calculations.
Notes: Expected changes in selling prices for firms in manufacturing. The chart shows the average expected selling prices over the next 12 months by quartiles of producer price increases in the third quarter of 2022. The producer price index is defined as the percentage change compared with the same period in the previous year. For firms in the first quartile, the country NACE Rev. 2 code level PPI is between -4.4% and 8%, between 8% and 13% for firms in the second quartile, between 13% and 18% for firms in the third quartile and between 18% and 80% for firms in the fourth quartile. The figures refer to the 28th round of the SAFE (October 2022-March 2023).
For more details on firms’ expectations for wages, see Box 1 “Ad hoc questions ‒ Firms’ expectations about selling prices and wages” in the report on the 28th round of the SAFE (October 2022-March 2023).
The “Statistical classification of economic activities in the European Community”, abbreviated as NACE, is the classification of economic activities in the European Union.
The group “retail sector firms” comprises firms operating mostly in the retail trade, car sales, passenger transport, accommodation and food services sectors, which are directly covered in the Harmonised Index of Consumer Prices (HICP). The firms in the “non-retail sector” group mainly operate in the manufacturing and construction sectors. This group more closely reflects intermediate goods or final goods that are less directly linked to consumer/retail. Although this exercise focuses on firms in sectors relevant for the HICP, the sample does not necessarily reflect the overall composition of the HICP basket. Consequently, firms’ expectations about their future selling prices reported here cannot be directly compared with commonly used measures of consumer price inflation expectations for three reasons. First, while retail sector firms are defined here as those in industries that are considered for the calculation of HICP, such firms may also be involved in wholesale, in which case their prices would instead reflect producer prices. Second, several firms sell intermediate goods rather than final goods, whereas only final goods are reflected in the HICP. Third, the answers refer to the firms’ own prices and not to an aggregate price index. The detailed sectoral information is derived by matching the individual survey responses to the financial statements of firms from Bureau Van Dijk’s Orbis database, the exercise is performed on a subset of 5,829 of 10,983 surveyed firms.
Weighted averages are calculated after trimming observations below the 1st percentile and above the 99th percentile of the country distributions. The median expectation for price and wage changes is exactly 5% across size classes.
See for example Ravenna, F. and Walsch, C.E., “Optimal Monetary Policy with the Cost Channel”, Journal of Monetary Economics, Vol. 53, No 2, March 2006, pp. 199-216).
Based on quarterly two-digit NACE Rev. 2 code – country level data, the median producer price index for the third quarter of 2022 is around 13%.
See also Box 3 “How have profits contributed to the recent strengthening of euro area domestic price pressures?” in this issue of the Economic Bulletin for further analysis on the contribution of unit profits to domestic price pressures in the euro area.
Karadi, P., Schoenle, R. and Wursten, J., “Measuring price selection in microdata: it’s not there”, Working Paper Series, No 2566, ECB, June 2021.