Regional labour market developments during the great financial crisis and subsequent recovery
Published as part of the ECB Economic Bulletin, Issue 4/2020.
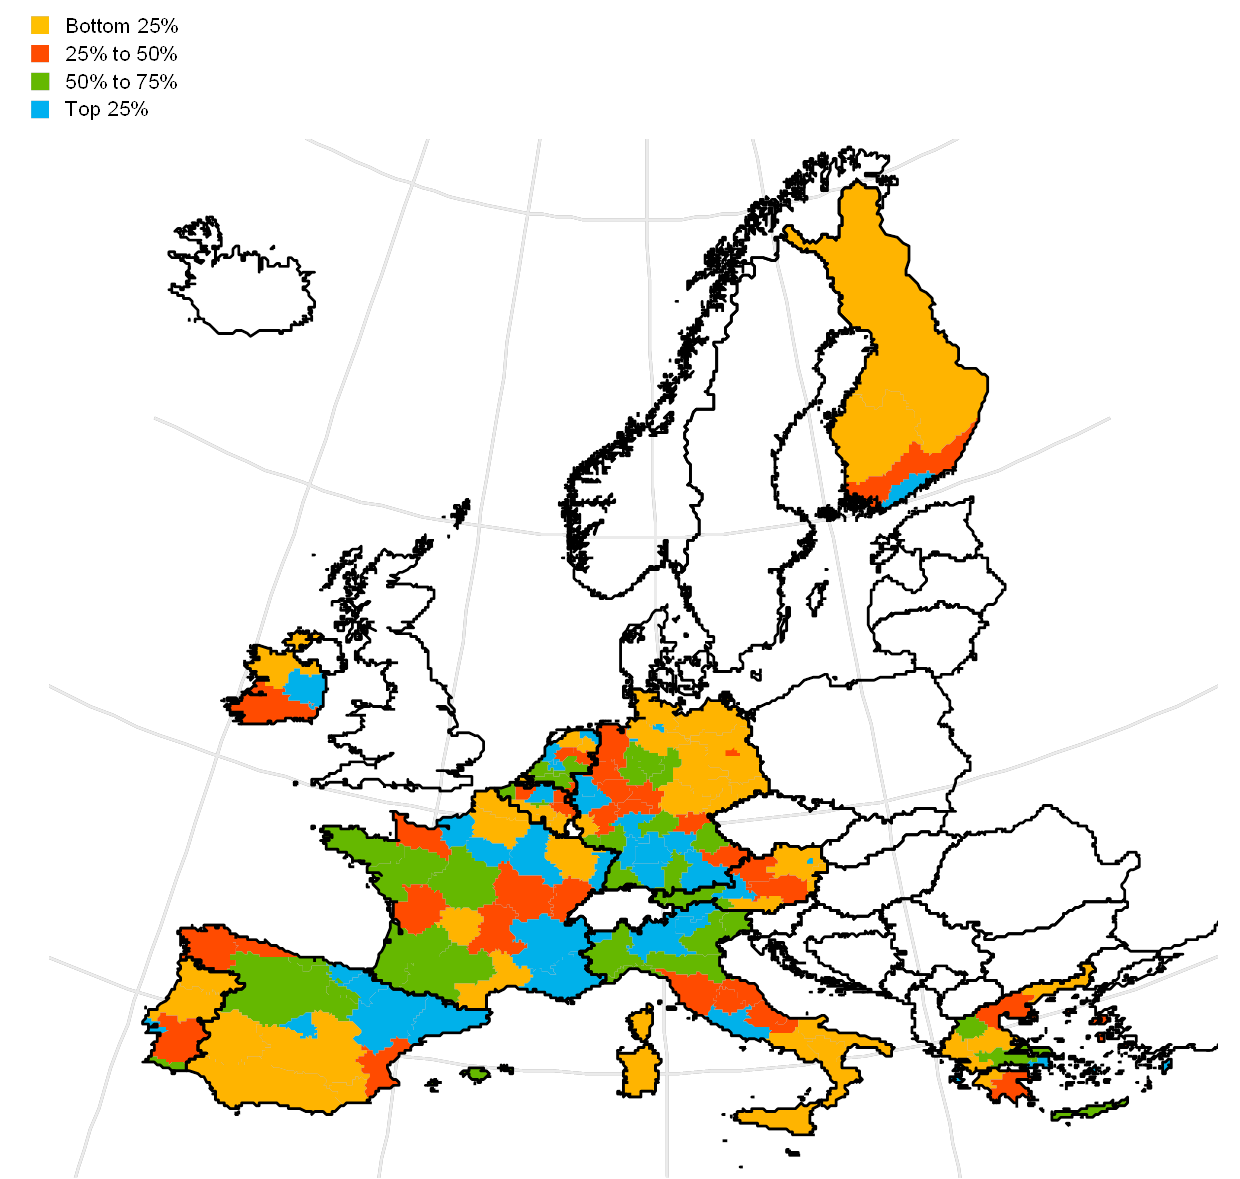
This box examines regional developments in labour input within the euro area from 2007, the peak in economic activity before the global financial crisis, until 2018. It uses the regional labour market indicators available from the Annual Regional Database of the European Commission (ARDECO).[1] For the purposes of comparison, we divide regions into four distinct groups (or quartiles) according to the 2007 GDP per capita distribution in each country (see Figure A). These groups are fixed over time.
Figure A
Euro area - Regional distribution of GDP per capita in 2007

Sources: ARDECO and ECB staff calculations.
Note: Regions are grouped according to the 2007 GDP per capita distribution in each country.
By 2018 total hours worked had recovered to their pre-crisis levels only in those regions at the top of the GDP per capita distribution, while in the remaining regions they still stood below their 2007 levels.[2] The response of total hours worked was asymmetric over the 2007-18 period, with employment in regions in the bottom 25% showing stronger losses during the recession period than the gains recorded during the subsequent recovery (see Chart A).[3] Between 2007 and 2018 total hours worked declined by 5.6% in the regions in the bottom quartile, while they increased by 3.2% in the top quartile regions. In the two middle quartiles, total hours worked show a similar profile to the euro area aggregate and by 2018 had returned to levels close to those observed in 2007. As a result, the share of total hours worked in the regions in the top quartile increased by 1.4 percentage points (from 38.7% in 2007 to 40.1% in 2018), while the share of the regions in the bottom quartile decreased by 1.2 percentage points (from 23.2% in 2007 to 22% in 2018).
Chart A
Regional developments in total hours worked between 2007 and 2018
(y-axis: log growth rate with respect to the levels observed in 2007)

Sources: ARDECO and ECB staff calculations.
Notes: Regions are grouped according to the 2007 GDP per capita distribution in each country. The figures for the euro area are aggregated using data from the 11 euro area countries listed in footnote 1.
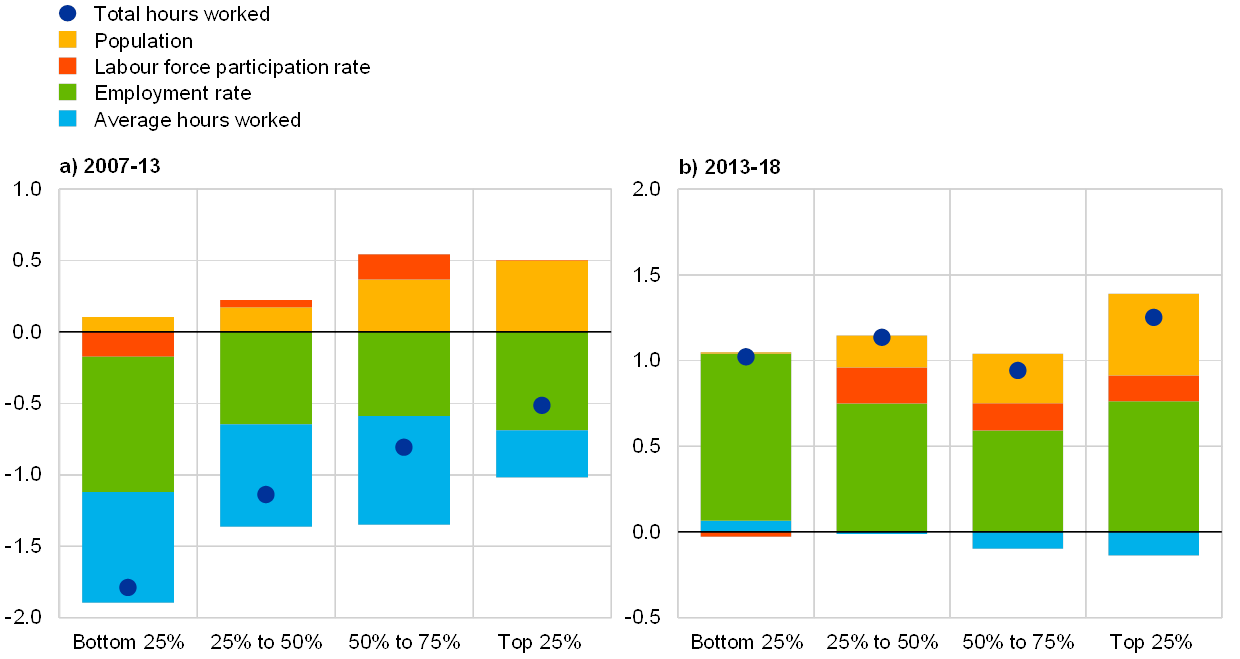
The smaller decline in total hours worked in the richer regions during the downturn, as well as the relatively homogeneous developments across regions during the recovery, can be attributed to changes in the employment rate, to the decline in average hours worked during the recession period, and to regional differences in population growth during both periods consistent with labour migrating from poorer to richer regions. Chart B shows how the various factors contributed to the dynamics in total hours worked across the four regional groups.[4] The employment rate is quantitatively the most important driver of the changes in total hours worked, accounting for more than 50% – in all regional groups – of both the decline in total hours worked during the recession period and the increase in total hours worked during the recovery period. The highest contribution came during the recovery period in the regions in the bottom 25%. The decline in average hours worked was also an important driver of the decline in total hours worked during the recession period across all regions, while its region-wide stabilisation after 2013 limited its impact during the recovery period. The employment rate and average hours worked channels moved in qualitatively similar ways across all regional groups. Developments in labour force participation and in population growth contributed more strongly to the growth of total hours worked in richer regions than they did in poorer regions. Population growth increased monotonically with the distribution of GDP per capita, with average annualised growth rates spanning from 0.1% for the regions in the bottom 25% to 0.5% for regions in the top 25%, while the differences in population growth across regions sharpened during the recovery phase. Finally, changes in the labour force participation rate mirrored those in population growth, albeit their contribution was quantitatively smaller across both periods. These patterns are consistent with the existence of migration flows from poorer to richer regions, with both population and labour force participation increasing in richer regions at the expense of poorer ones. On the other hand, migration flows contribute to an initial upturn in the employment rate and in average hours worked in poorer regions, while the impact of migration on employment and hours worked in richer regions can be either mitigated or enhanced by demand-side factors.
Chart B
Drivers behind the long-term changes in regional total hours worked.
(y-axis: contribution to the growth rate of total hours worked, in %; x-axis: groups of regions)

Sources: ARDECO and ECB staff calculations.
Notes: Regions are grouped according to the 2007 GDP per capita distribution in each country. The figures for the euro area are aggregated using data from the 11 euro area countries listed in footnote 1.
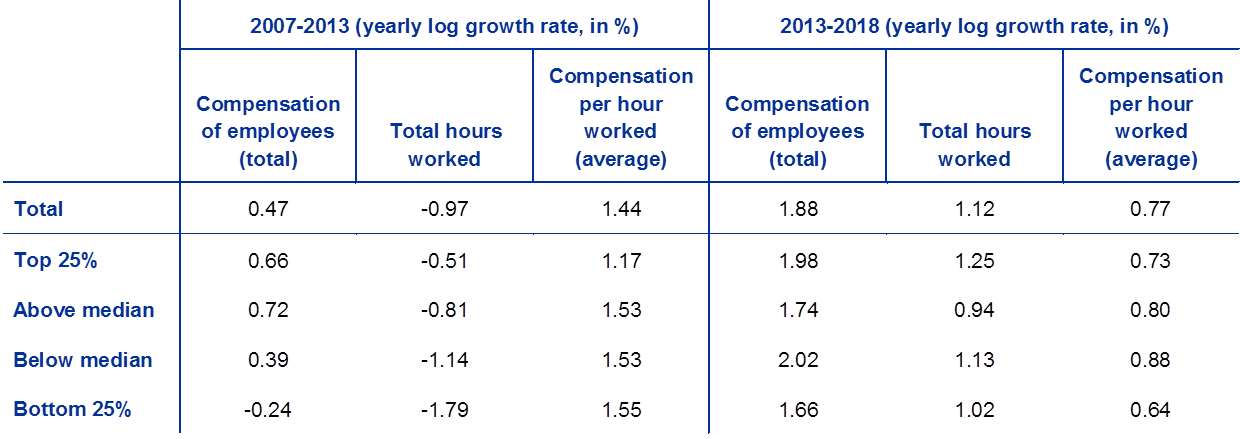
The widening gap in the compensation of employees between regions is mostly driven by the regional dispersion of the long-term changes in total hours worked, with the growth rates of compensation per hour worked being broadly comparable across regions (see Table A). The share of compensation of employees in the regions in the top 25% increased by 0.7 percentage points between 2007 and 2018, from 45.2% in 2007 to 45.9% in 2018. In the regions in the bottom 25%, the share decreased by roughly 0.9 percentage points over the same period, from 18.1% in 2007 to 17.2% in 2018. However, the widening gap in compensation of employees across regions stems mostly from regional developments in labour input. The growth rate of compensation per hour worked is in fact comparable across regions, and during the contraction period was even lower for the regions in the richest 25% than for the remaining regions. This development may be explained by the fact that labour supply increased in rich regions as a result of migration flows both from poorer to richer regions and from outside the euro area. The similar rate of increase in compensation per hour worked across regions may be related to the strong increase in labour supply in richer regions and to the mitigation of the decline in average hours worked in the remaining regions during the contraction period. The developments in compensation per hour worked may also be related to the country and industrial composition of the groups of regions and, therefore, to the impact of labour market policies in place during the great financial crisis and subsequent recovery, such as short-time working schemes and wage-bargaining agreements.[5]
Table A
Growth in total hours worked and in compensation of employees across the euro area

Sources: ARDECO and ECB staff calculations.
Notes: Regions are grouped according to the 2007 GDP per capita distribution in each country. The figures for the euro area are aggregated using data from the 11 euro area countries listed in footnote 1.
Overall, the evolution of total hours worked in the euro area between 2007 and 2018 was very heterogeneous across regions, with richer regions being more insulated during the recession period and poorer regions not fully catching up during the recovery period. These differing patterns across regions can be attributed to changes in the employment rate, to the decline in average hours worked during the recession period, and to the stability of regional differences in population growth during both the recession and recovery periods. Migration from poorer to richer regions within the euro area is likely to be a driving force behind those trends, and may, in turn, have contributed to the increase in regional differences in compensation of employees between 2007 and 2018. Moreover, the gap between richer and poorer regions in the cumulative growth of total hours worked, employment and compensation of employees widened in a number of euro area countries between 2007 and 2018, in addition to the cross-country heterogeneity in labour market patterns. The heterogeneous impact on total hours worked, employment and compensation might also be related to the observed differences in the sectoral composition of the different regional groups, with the sectors experiencing the largest drop in employment and cumulative wages tending to be located in regions with a lower GDP per capita rate, while thriving industries are mainly based in richer regions.
- The ARDECO dataset was created by the European Commission’s Directorate General for Regional and Urban Policy and is currently maintained and updated by the Joint Research Centre. This box uses the data update of 7 April 2020 and focuses on non-outermost regions as identified by level 2 of the 2016 Nomenclature of Territorial Units for Statistics (NUTS2). The countries considered in the analysis are Belgium, Germany, Ireland, Greece, Spain, France, Italy, the Netherlands, Austria, Portugal and Finland. The figures reported for the euro area as a whole comprise the aggregation of the regions in these 11 euro area countries (euro area 11), which represent the euro area in 2007 with the exception of Luxembourg and Slovenia.
- The results are not driven by the assignment of regions to the different quartiles of their within-country GDP per capita distribution in 2007, as the results of the analysis described in this box still hold when regions are grouped by the euro area GDP per capita distribution in 2007, or when a single country is removed from the analysis.
- During the contraction phase (2007-13), the average annual growth rate of total hours worked stood at -0.5% for the top 25% regions, -0.8% for the regions in the above median group, -1.1% for the regions below the median, and -1.8% for the regions in the bottom 25% group. For the euro area as a whole, the average annual decline in total hours worked between 2007 and 2013 stood at -0.97%. The pace of increase in total hours worked during the recovery period was faster in the regions in the top 25% group (1.2%) than in the remaining regions (around 1% per year).
- Long-term changes in total hours worked over a specific period can be restated as the sum of the growth rate of the population over that period, of changes in the labour force participation rate, of changes in the employment rate, and of the growth rate in average hours worked per person employed.
- Short-time working schemes may have influenced the increase in compensation per hour worked by allowing for greater flexibility in the decline of average hours worked by employees during the contraction period while protecting workers’ pay during the same period. At the same time, national wage bargaining agreements may also partly explain the stronger wage per hour growth performance seen in the bottom two quartiles by comparison with regions in the top two quartiles.


