
Sources of supply chain disruptions and their impact on euro area manufacturing
Published as part of the ECB Economic Bulletin, Issue 8/2021.
The euro area recovery over the course of 2021 has been affected by increasing global supply chain disruptions. Real GDP growth in 2021 was predominantly supported by a recovery in business services, while industry and construction have contributed to a lesser degree due to shortages of imported intermediated inputs and equipment. Global supply chain disruptions have been the result of the interplay of several factors, which can be grouped into five main categories: (i) early strong rebound in global demand for manufacturing goods; (ii) supply shortages of specific semiconductors; (iii) logistical disruptions in the transport sector, primarily linked to container vessel activity; (iv) strict lockdown measures in some key Asian countries that produce intermediated inputs; (v) time needed to increase supply capacity of semiconductor production and of vessels.
The imbalance between the sharp recovery in global demand and the supply shortages has been more severe and protracted than initially expected. The global surge in high-tech demand from households needing to work from home and from firms needing to upgrade their internet capacity and network access, together with supply disruptions resulting from the coronavirus (COVID-19) pandemic, has generated a crisis in the supply of semiconductors, which has, in particular, adversely affected the automobile industry.[1] Equally relevant is that container vessel activity also sustained a major shock as a result of the pandemic. With the collapse of world trade in April 2020, cargo ships were not able to run at full capacity and many containers were left to pile up in western countries’ ports due to the lockdowns. After the summer of 2020, once global demand had picked up again, the lack of containers to transport these goods from Asia to the United States and Europe, as well as numerous vessels arriving at their destinations well outside of schedule (exacerbated by the massive container ship that blocked the Suez Canal), led to considerable supply bottlenecks. According to UNCTAD, the average time spent by container vessels in ports in the first half of 2021 was 11% higher compared with the pre-pandemic average in 2018-19. In Europe, due to congestion, scheduling delays and infrastructure constraints, German and French ports saw a very large increase in average port stays (e.g. 42% and 25% higher than their average in 2018 and 2019), thus standing even higher than those seen in the United States. Belgium, Italy and the Netherlands, on the other hand, all saw changes more in line with the global average (Chart A). Another issue that exacerbated these supply bottlenecks was the renewed lockdown measures resulting from the spread of the Delta variant in some countries of the Asia-Pacific region (including Malaysia, Singapore, Thailand and Vietnam), which are key to the semiconductor chip production. According to the ECB’s contacts in the corporate sector, both semiconductor foundry capacity and cargo vessel capacity are expected to remain tight into 2023.[2]
Chart A
Median time in ports for container ships in the first half of 2021 against the 2018-19 average
(ratio)
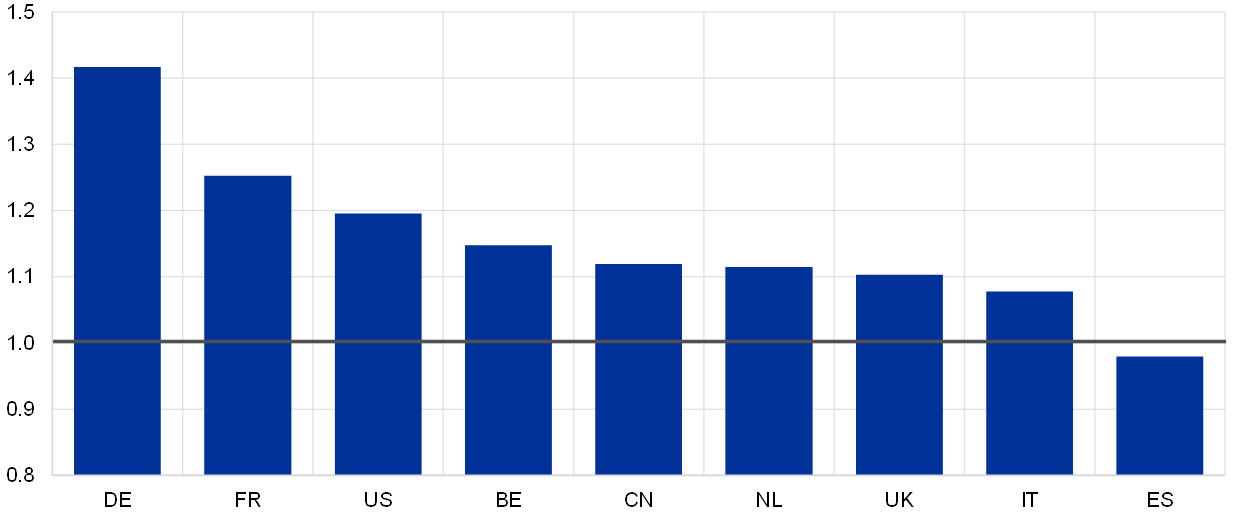
Sources: UNCTAD (United Nations Conference on Trade and Development) and ECB staff calculations.
Note: The latest observation is for June 2021.
During normal times, increases in production are generally associated with longer suppliers’ delivery times and declining inventories. Before the pandemic, the key mechanism at play was that an increase in demand would lead to an increase in production, delaying the delivery of goods to firms and lowering inventory levels; however, an efficient allocation of resources thanks to globalisation would help to improve supply processes and speed up delivery times. Since the second half of 2020, it is not only a strong demand that has triggered longer delivery times but also the supply bottlenecks that are causing severe delays, to the point of implying a decline in production (Chart B). These bottlenecks caused material and/or equipment shortages that prevented euro area firms from being able to adequately respond to the rapid recovery in demand for manufacturing goods, which subsequently led to a fall in inventories across all sectors (Chart C). This new development can be exploited to assess the degree to which supply bottlenecks are behind the weakness in euro area industrial production.
Chart B
Euro area industrial production, suppliers’ delivery times and inventories
(left-hand scale: year-on-year growth rate; right-hand scale: z-scores)

Sources: Eurostat, European Commission, IHS Markit and ECB staff calculations.
Notes: Z-scores are computed for each indicator by subtracting their respective means and dividing the obtained difference by their respective standard deviations computed over the period 1999-2019. The latest observations are for September 2021 (for industrial production), October 2021 (for PMI suppliers’ delivery times for technology equipment) and November 2021 (for PMI suppliers’ delivery times in total and inventories).
Chart C
Euro area inventories relative to production expectations by sector and equipment and material shortages
(z-scores)
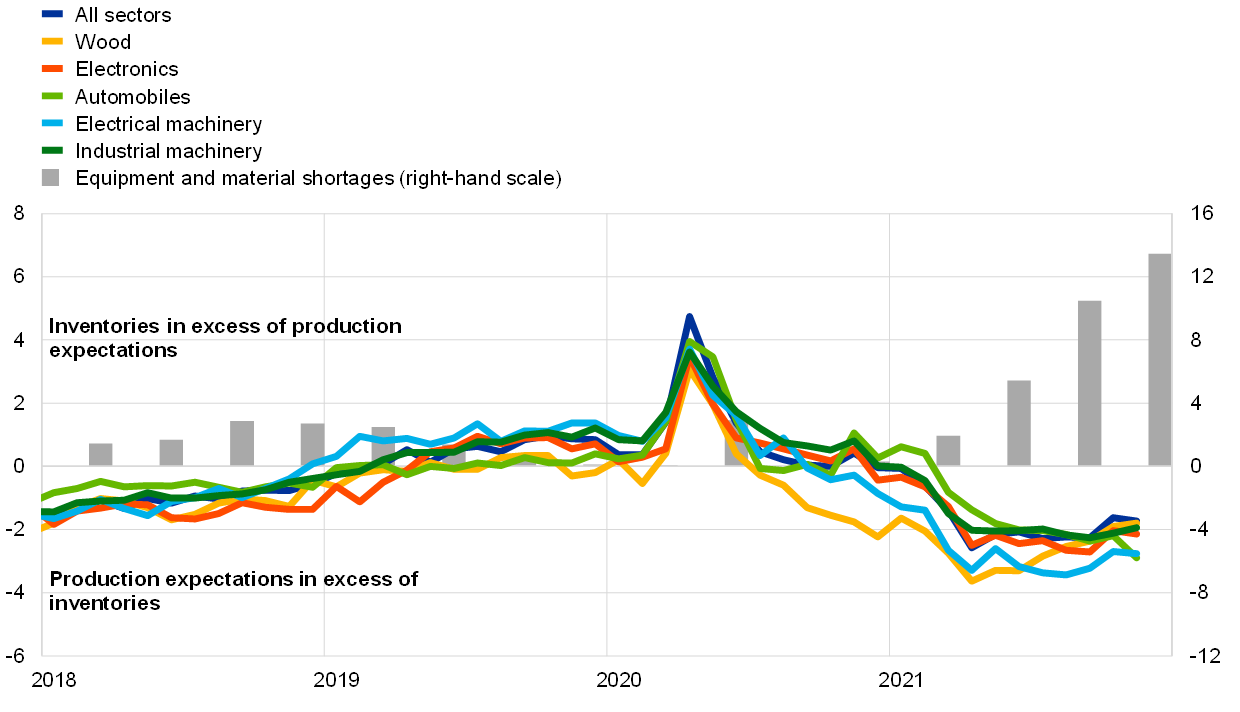
Sources: Eurostat, European Commission and ECB staff calculations.
Notes: Z-scores are computed for each indicator by subtracting their respective means and dividing the obtained difference by their respective standard deviations computed over the period 1999-2019. The latest observations are for October 2021 (for inventories relative to production expectations) and November 2021 (for equipment and material shortages).
A structural vector autoregression (SVAR) model can be used to disentangle the relative importance of the key drivers of developments in both delivery times and industrial production. Specifically, this model identifies the contribution from demand, interest rate, financial, cost-push and bottleneck shocks, using the HICP, industrial production (excluding construction), the ten-year OIS rate, corporate spreads and PMI suppliers’ delivery times.
The model suggests that supply bottlenecks have hampered industrial production considerably over the course of 2021. According to the model, between October 2020 and September 2021, around 45% of the change in euro area PMI suppliers’ delivery times was driven by aggregate demand forces (i.e. the sum of demand, interest rate and financial shocks), around 45% by supply bottlenecks and roughly 10% by other types of cost-push shocks (Chart D, left-hand scale). The contribution from demand, supply bottlenecks and cost-push shocks to industrial production is shown in Chart D, right-hand scale. Everything else being equal, supply bottlenecks are estimated to have reduced the level of euro area industrial production by around 2.6% cumulatively between October 2020 and September 2021 compared with a scenario without bottlenecks.[3]
Chart D
Contribution from supply bottleneck shocks on euro area industrial production and PMI suppliers’ delivery times
(left-hand side: diffusion index in deviation from baseline; right-hand side: percentage in deviation from baseline, cumulated from October 2020 to September 2021)
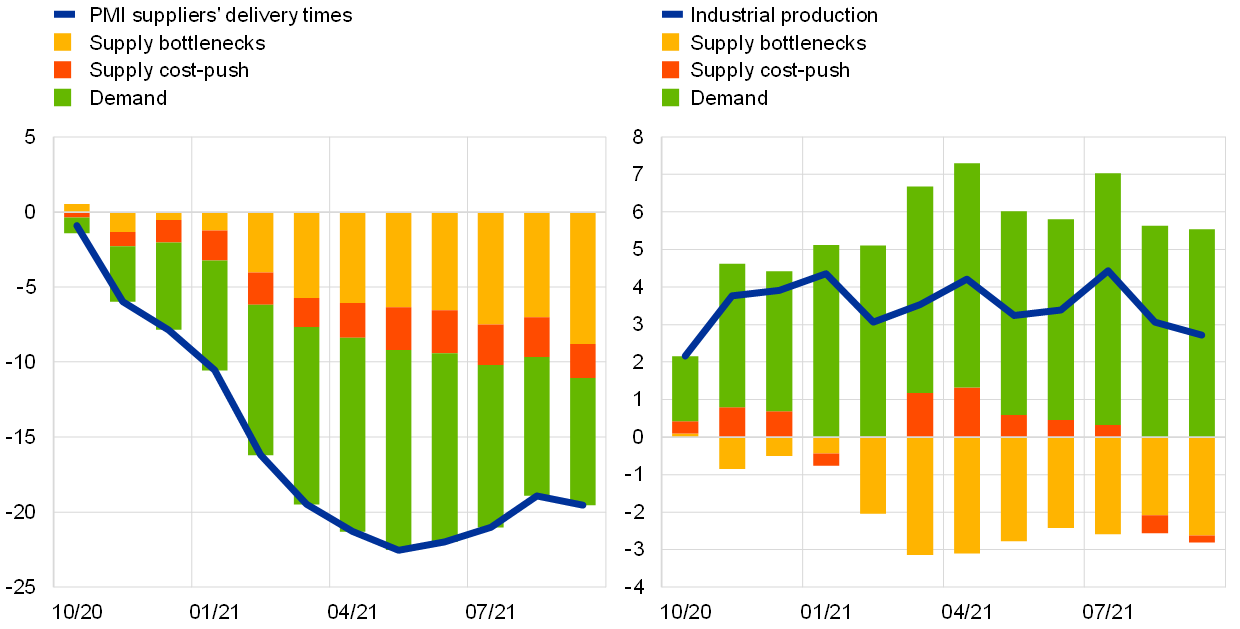
Sources: Eurostat, European Commission and ECB staff calculations.
Notes: The model shows the contribution from aggregate demand (demand, interest rate, financial shocks), cost-push and bottleneck shocks, using the HICP, industrial production (excluding construction), the ten-year OIS rate, corporate spreads and PMI suppliers’ delivery times. The model is based on euro area aggregate data from January 1999 to September 2021 and the shocks are identified using the method employed by J. Antolín-Díaz and J.F. Rubio-Ramírez in the “Narrative Sign Restrictions for SVARs”, American Economic Review, No 108, 2018, pp. 2802-2829. The assumed sign restrictions at impact are as follows: demand shocks imply HICP (+); industrial production (+); ten-year OIS rate (+); corporate spreads (-); and PMI suppliers’ delivery times (-). Interest rate shocks imply HICP (-); ten-year OIS rate (+); corporate spreads (+). Financial shocks imply industrial production (-) and corporate spreads (+). Cost-push shocks imply HICP (+) and industrial production (-). Bottleneck shocks imply HICP (+); industrial production (-) and PMI suppliers’ delivery times (-). The assumed narrative restrictions are as follows: the largest contribution to the forecast errors for the ten-year OIS rate in January 2015 is attributed to monetary policy shocks; for corporate spreads in July 2007 it is attributed to financial shocks; for PMI suppliers’ delivery times in April 2020 and March 2021 it is attributed to bottlenecks shocks. It is also assumed that all financial shocks have a positive sign in September and October 2008 and that all demand shocks have a negative sign in March and April 2020.
By February 2021, the effect of supply bottlenecks on industrial production began to become increasingly noticeable. Survey indicators available for the fourth quarter of 2021 suggest that this impact will most likely not have been reabsorbed by the last quarter of this year. Given that industry excluding construction accounts for roughly 20% of total euro area value added, the above estimates imply that in 2021 real GDP growth would have been around 0.5% higher in the absence of supply bottlenecks. This estimate can be considered a lower bound, as supply bottlenecks continued to affect production in the last quarter of 2021, as well as construction and business services.
The effects of supply bottleneck shocks could persist through much of 2022. The semiconductor shortages, negative pandemic developments in Asia and current congestion at container ports are unlikely to ease very much, suggesting that the euro area economy is expected to continue to be affected by these shocks over the coming months and that the impact of supply bottleneck shocks could persist through much of 2022, as also highlighted by the ECB’s contacts in the corporate sector. According to the European Commission business and consumer surveys in October 2021, businesses expected a further deterioration in material shortages over the next three months in all euro area countries, except for very few smaller countries (Chart E). The larger the share of respondents confirming that their businesses were affected by shortages compared with the respective long-term average, the larger the share of respondents that expected a further deterioration in their situation, which corroborates with the overall assessment of a prolonged and persistent impact from supply bottlenecks.
Chart E
Euro area countries’ shortages of equipment and material expected in the fourth quarter of 2021
(x-axis: percentage of respondents, levels de-meaned by historical average; y-axis: percentage of respondents, difference compared with the third quarter of 2021)
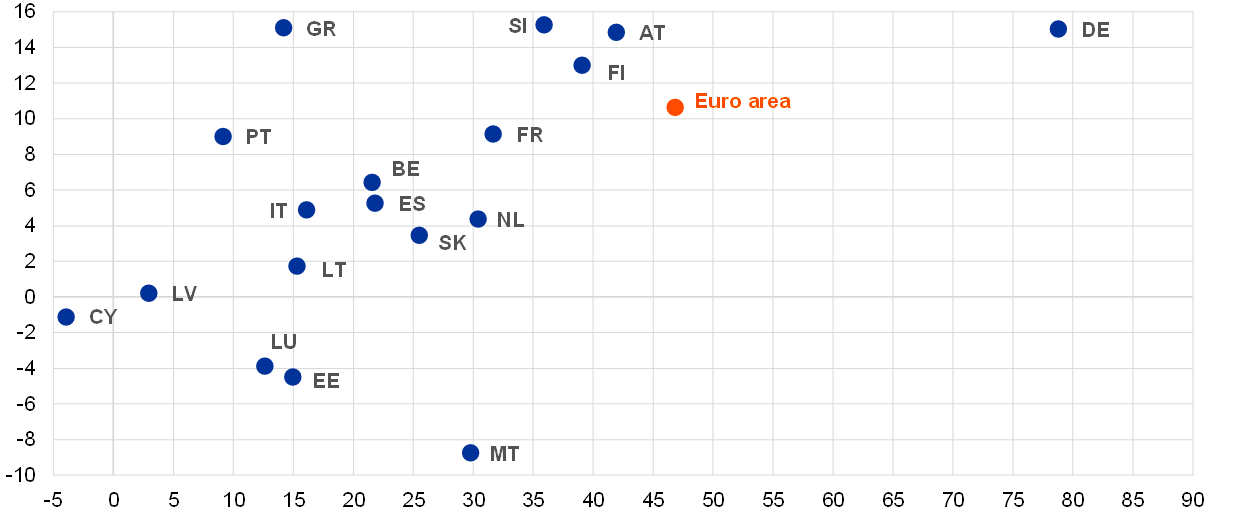
Sources: Eurostat, European Commission and ECB staff calculations.
Notes: The values for each indicator are computed by subtracting their respective mean for each economy over the period 1999-2019. The latest observation is for October 2021.
- For further information on developments in semiconductor industries, see European Central Bank, “What is driving the recent surge in shipping costs”, Economic Bulletin, Issue 3, ECB, 2021; European Central Bank, “The semiconductor shortage and its implication for euro area trade, production and prices”, Economic Bulletin, Issue 4, ECB, 2021; the Special Issue in the Autumn 2021 European Economic Forecast by the European Commission, and the discussion paper entitled “Bottlenecks: causes and macroeconomic implications” by the Bank for International Settlements, BIS Bulletin, No 48, BIS, 2021.
- With regard to firms’ views on the persistence of supply constraints, see European Central Bank, “Main findings from the ECB’s recent contacts with non-financial companies”, Economic Bulletin, Issue 7, ECB, 2021.
- Exports have also been strongly affected by supply bottlenecks, as described in European Central Bank, “The impact of supply bottlenecks on trade”, Economic Bulletin, Issue 6, ECB, 2021. For further details of the contribution from supply shocks to global industrial production and trade, see Box 1 entitled “Supply chain disruptions and the effects on the global economy” in this issue of the Economic Bulletin.