Housing costs and homeownership in the euro area
Published as part of the ECB Economic Bulletin, Issue 1/2021.
Housing costs represent a significant share of the household budget. Housing costs typically include the utility costs (water, electricity, gas and heating), maintenance, and rental or mortgage interest payments, altogether accounting for around one-fifth[1] of household income expenditure in 2019. Changes in these costs are closely linked with housing market developments, such as rental and house prices, as well as mortgage payments. Furthermore, housing costs are dependent on structural features, which will be the focus of this box, such as the homeownership rate or certain household characteristics. This is due to the fact that tenants and less affluent households, for example, tend to spend a large share of their income on housing. Against this background, this box examines certain data that help to frame the housing cost burden in the euro area and across types of household.
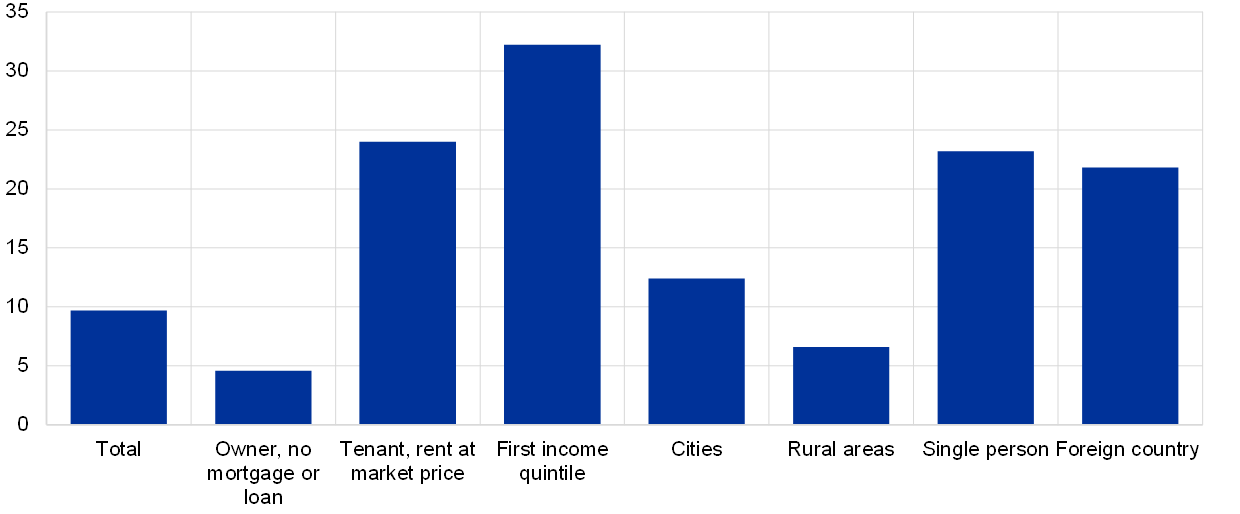
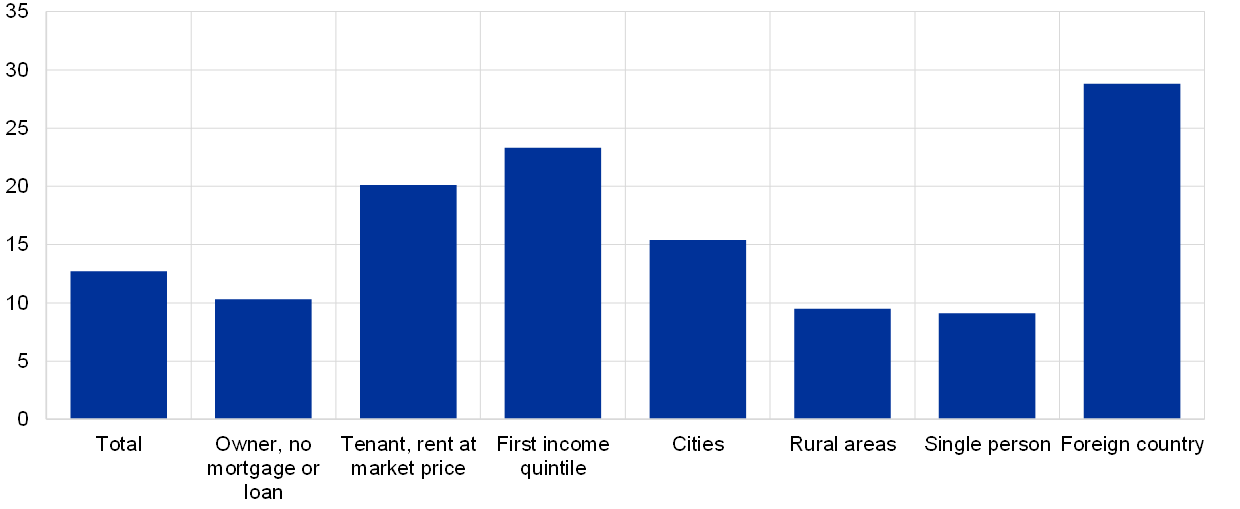
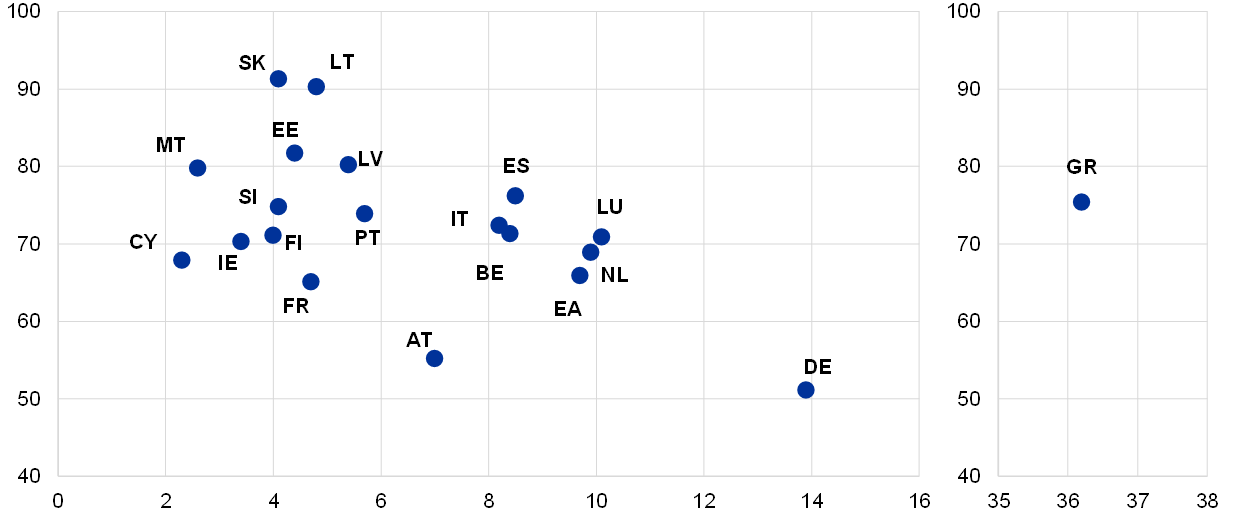
Housing cost burden and overcrowding tend to be distributed unevenly across households. A common indicator of household stretch is the housing cost overburden rate, which is the percentage of the population living in a household where the total housing costs amount to more than 40% of the disposable income.[2] In the euro area, around 10% of households were overburdened in 2019 (Chart A). This aggregate figure masks considerable heterogeneity across households, with 24% of those tenants renting at market price being overburdened, compared with less than 5% in the case of outright owners (mortgage-free owners). Based on the same metric, more than 12% of all households in cities exceeded this threshold in 2019 compared with less than 7% in rural areas. Moreover, and unsurprisingly, around one-third of all households in the lower quintile of the income distribution was overburdened in 2019. In addition, the housing cost overburden rate was high for both single and foreign households (over 20%). Households facing a higher cost overburden rate – tenants, households with lower incomes, those living in cities and foreigners – were apparently also those more likely to be living in overcrowded dwellings (Chart B). Finally, the overburden rate varies considerably across euro area countries and, in general, it appears to be lower in countries where the homeownership rate is higher (Chart C). These developments highlight the importance of household choices and characteristics when it comes to the housing cost burden.
Chart A
Housing cost overburden rate in the euro area in 2019
(percentages)
Source: EU-SILC.
Notes: Distribution of population with housing costs of over 40% of disposable income. For “foreign country”, data refer to the population aged 18 or over.
Chart B
Housing overcrowding rate in the euro area in 2019
(percentages)
Source: EU-SILC.
Notes: The overcrowding rate is defined as the percentage of the population living in an overcrowded household that does not have at its disposable a minimum number of rooms equal to: (i) one room for the household; (ii) one room per couple in the household; (iii) one room for each single person aged 18 or over; (iv) one room per pair of single people of the same gender between 12 and 17 years of age; (v) one room for each single person between 12 and 17 years of age and not included in the previous category; and (vi) one room per pair of children under 12 years of age. For “foreign country”, data refer to the population aged 18 or over.
Chart C
Housing overburden rate and homeownership rate across euro area countries
(x-axis: housing overburden rate; y-axis: homeownership rate; percentages)
Source: EU-SILC.
Note: The latest observations are for 2019, except for Ireland, France, Italy and Slovakia for which they refer to 2018.
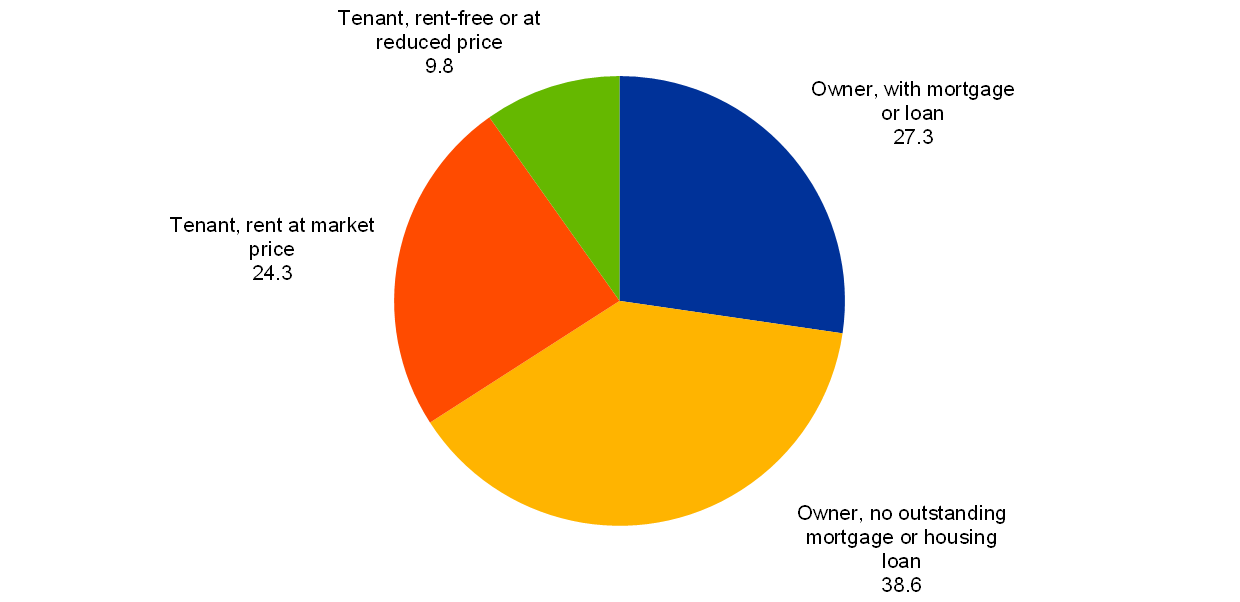
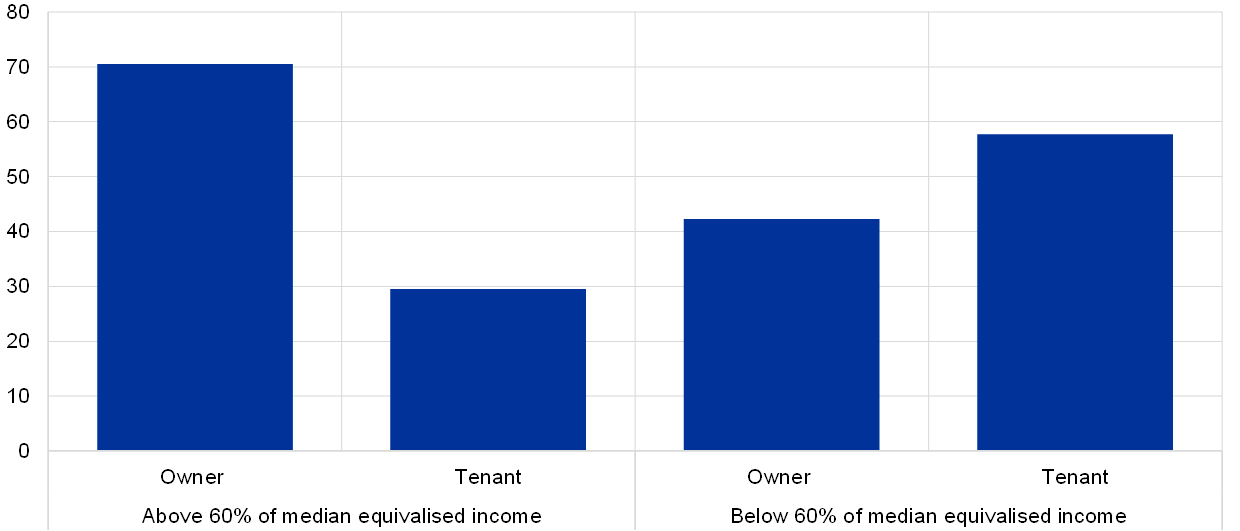
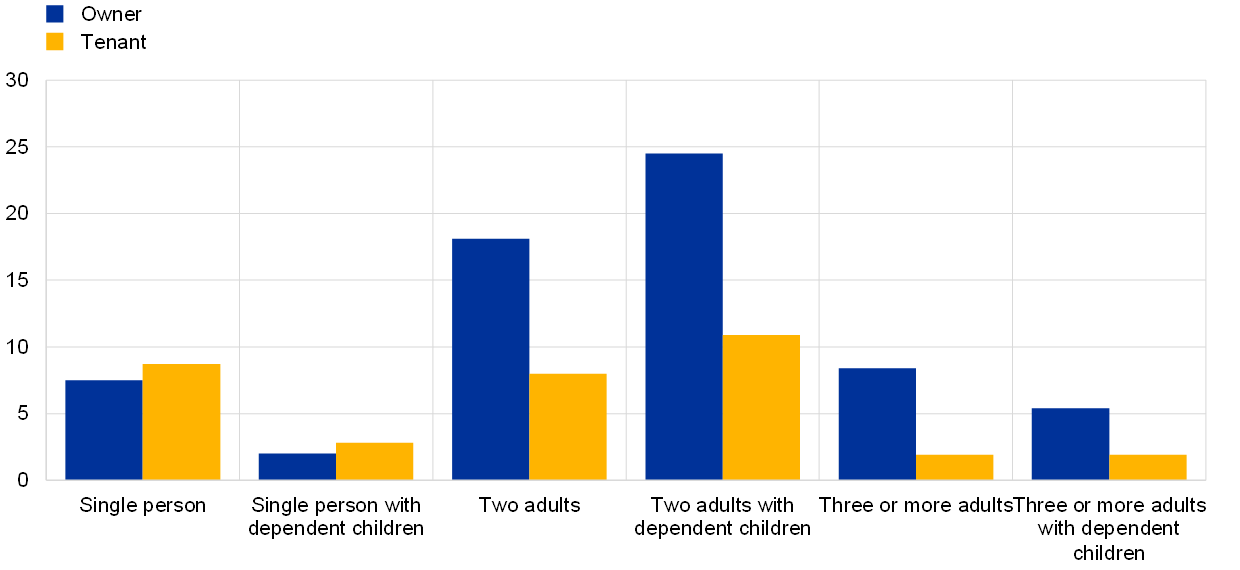
The relationship between homeownership and housing cost burden depends on household characteristics. Roughly two-thirds of euro area households were homeowners in 2019. Outright homeownership stood close to 39%, while 27% of households had a mortgage or loan (Chart D). As for tenants, the vast majority rented at market price and less than one-third rented at a reduced price. Tenure status varied across households, with differing characteristics. Starting with income, households with an income above 60% of the median (equivalised) income were predominantly homeowners and those with an income below this threshold were mainly tenants (Chart E). Furthermore, the percentage of single households in rented accommodation was higher than for those that owned their property, while in the case of larger households the opposite was true (Chart F).
Higher homeownership rates are not necessarily good or bad. A higher share of homeownership can be associated with both positive and negative economic outcomes. Homeowners are generally less burdened than tenants by housing costs, particularly in cases where they are mortgage-free or have a high income. Furthermore, higher homeownership rates can also be correlated with a greater sense of community in certain neighbourhoods or with better educational outcomes for the offspring. In addition, homeownership, and the associated housing wealth, is distributed more evenly across households compared with financial wealth, such as equity and bonds. These are generally held by a proportionally smaller share of the population at the top of the wealth distribution bracket, thus a high homeownership rate could possibly imply beneficial effects in terms of inequality.[3] However, higher homeownership rates may also be associated with reduced geographical mobility, which can prevent efficient labour market outcomes, hampering the relocation of workers to more productive regions.[4] A larger share of homeowners may also be associated with a less developed rental market.[5] Furthermore, a tax system that disproportionately favours homeownership, through interest rate deductibility and other forms of related tax incentives, can be distortive.
Chart D
Euro area tenure status in 2019
(percentages)
Source: EU-SILC.
Chart E
Euro area tenure status by income characteristic in 2019
(percentages)
Source: EU-SILC.
Chart F
Euro area tenure status by type of household in 2019
(percentages)
Source: EU-SILC.
The unfolding coronavirus (COVID-19) crisis may exacerbate the heterogeneity of the housing cost burden across households. Looking ahead, the negative effects of the COVID-19 crisis are likely to be particularly severe for the most disadvantaged households and to exacerbate existing differences, including those related to the housing cost burden.[6] This is, for instance, due to the fact that housing costs tend to be resilient in relation to income levels, thus posing a challenge whenever income is negatively affected, as in the case of the current pandemic. That said, the broader and medium-term impact of the COVID-19 crisis on the housing market in terms of the structural changes and household choices is something that can only be observed over time.
- This includes imputed rents.
- Housing costs and disposable income are both net of housing allowances. They are obtained from microdata based on household responses included in the surveys by EU statistics on income and living conditions (EU-SILC). For further details, see Eurostat.
- For a discussion, see Causa, O., N. Woloszko and D. Leite, “Housing wealth accumulation and wealth distribution: Evidence and stylised facts”, OECD Economics Department Working Papers, No 1588, OECD, Paris, December 2019.
- See, for example, Barceló, C., “Housing tenure and labour mobility: a comparison across European countries”, Working Papers, No 0603, Banco de España, February 2006.
- For a discussion, see Halket, J., and Pignatti Morano di Custoza, M., “Homeownership and the scarcity of rentals”, Journal of Monetary Economics, Vol. 76, November 2015, pp. 107-123.
- See “COVID-19: Protecting people and societies”, OECD, 2020.


