- SPEECH
- Frankfurt am Main, 14 November 2019 [Updated on 14 November at 13:20]
The international transmission of monetary policy
Keynote speech by Philip R. Lane, Member of the Executive Board of the ECB, CEPR International Macroeconomics and Finance Programme Meeting
It is a pleasure to speak at the annual meeting of the CEPR’s International Macroeconomics and Finance (IMF) Programme, hosted this year here at the ECB.[1],[2] I briefly led this programme before my switch to central banking in 2015 and my aim in this speech is to explore some inter-connections between the research agenda of this programme’s research agenda and the analytics of the monetary policy issues that occupy me in my current role. In particular, I wish to focus on the international transmission of the ECB’s monetary policy, which is central to evaluating how our monetary policy affects both the euro area economy and, through various spillover mechanisms, the global economy.[3]
The euro area is deeply integrated into the global economy, which means that our analysis universally needs to take into account open-economy dimensions. The euro area contributes about 15 percent to global GDP and accounts for a similar share of global exports and imports. Furthermore, the participation of European firms in global value chains is substantial: even excluding intra-euro area trade, foreign value added as a percentage of gross exports amounts to as much as a fifth of gross exports. On the financial side, euro-denominated asset prices are heavily influenced by global factors, while the high volumes of external assets and liabilities held by euro area residents mean that the international balance sheet is quantitatively important in determining the impact of domestic and foreign shocks.
In examining the international transmission of our monetary policy, I will focus on four dimensions: first, the external balance; second, the exchange rate; third, global liquidity conditions; and fourth, international financial flows.[4]
Monetary policy and the external balance
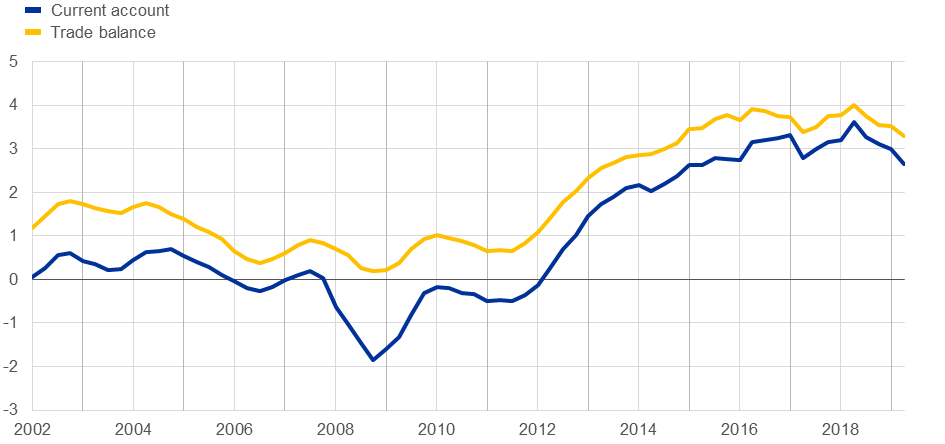
Chart 1 shows the evolution of the current account balance and the trade balance for the euro area. A striking feature is the sustained surplus position that has emerged in recent years. We know that low-frequency factors such as demographics contribute to this pattern (in addition to the role played by fiscal policy) but it is useful to explore whether our monetary policy has also played a role. In this regard, it is important to keep in mind that a monetary easing that is common to major regions across the world should leave the external balance largely unaffected, whereas an asymmetric monetary easing may affect the external balance.
A priori, the overall effect of a monetary policy easing on the external balance is non-trivial.[5] Along one dimension, if easier monetary policy raises domestic income, increased spending on imports will weaken the external balance. Along another dimension, if accommodative monetary policy generates a weaker exchange rate, this is expected to improve the trade balance (under typical calibrations).[6],[7] Of course, the timing and quantitative effects of exchange rate movements on macroeconomic outcomes depend on the microstructure of international trade. For instance, the currency of invoicing matters: under producer currency or dominant currency pricing, the trade balance improves due to expenditure switching effects; under local currency pricing, this occurs primarily through terms of trade effects. At the same time, the importance of the invoicing currency becomes less relevant at medium to long-term horizons, once firms adjust their markups and prices. Finally, exchange rate movements can also affect the current account balance through the revaluation of international income receipts and payments.[8]
Euro area current account balance and trade balance
(percentage of GDP)
Source: ECB.
Latest observation: Q2 2019.
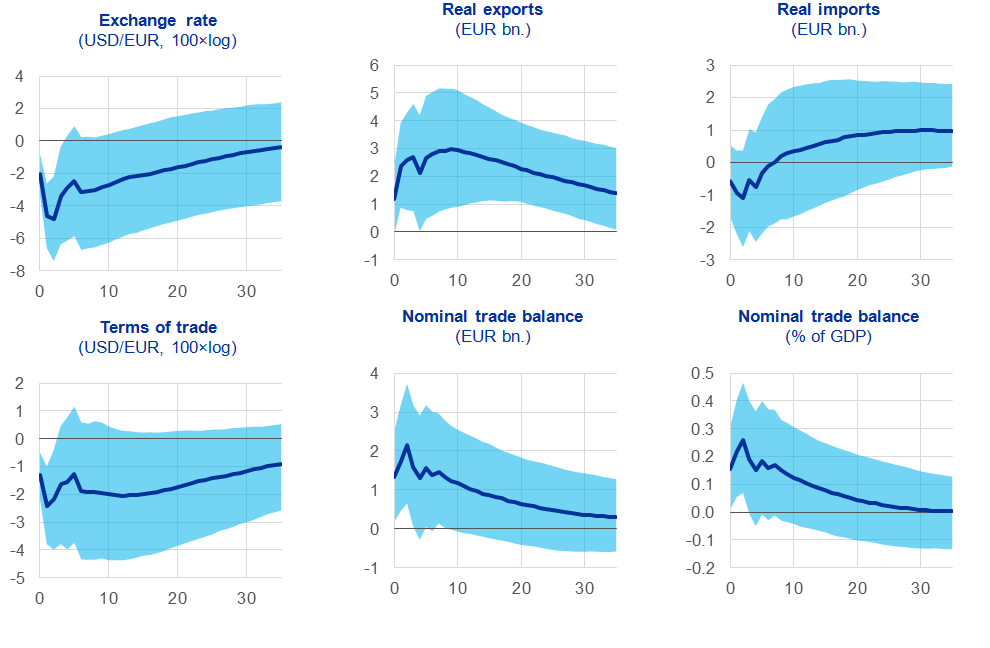
Turning to the empirical evidence, recent ECB staff analysis suggests that the net impact of a monetary policy expansion on the trade balance is positive.[9] Chart 2 shows the effect of an unexpected accommodative monetary policy shock, which is identified using the high-frequency response of financial asset prices in the wake of ECB monetary policy decisions. The shock weakens the euro exchange rate; stimulates both euro area exports and imports; and generates a significant and persistent decline in the terms of trade. In net terms, the positive effects dominate: the response of exports is stronger than the increase in imports and the decline in the terms of trade.
Impulse responses to an accommodative monetary policy shock – trade balance
Source: ECB.
Notes: Trade in oil-related products and their respective prices are excluded from all applicable series. Estimates are obtained with a VAR(6) model on monthly observations over the period January 2000 to December 2018, including one-year Bund interest rates, euro area stock prices, corporate bond spreads, industrial production and consumer price indices where the monetary policy shock is identified using the high-frequency response of financial asset prices shortly after ECB monetary policy meetings in the spirit of Jarocinski, M. and Karadi, P. (2019), “Deconstructing Monetary Policy Surprises - The Role of Information Shocks”, AEJ Macroeconomics, forthcoming. The shock is re-scaled to correspond to a 25 basis point decline in the one-year Bund on impact.
Monetary policy and the exchange rate
Let me now turn to a wider discussion about the interplay between our monetary policy and the dynamics of the euro exchange rate. Of course, the exchange rate is not a policy target for the ECB. Our monetary policy measures are solely geared towards ensuring convergence to our inflation aim over the medium term. Our internal model-based calculations suggest that only around a quarter of the fluctuations in the euro-dollar exchange rate since the summer of 2014 can be attributed to euro area monetary policy, while more than half of the variation reflects the evolution of US macro conditions as well as global risk factors (Chart 3).[10]
Drivers of the EUR/USD exchange-rate
In analysing the effect of monetary policy on the exchange rate, it is worth bearing in mind that monetary policy measures that anchor the short end of the curve (such as the negative interest rate policy or forward guidance on the future rate path) may have different effects from measures that operate on term premia, such as the asset purchase programme (APP).[11]
The forward-iterated solution of the uncovered interest rate parity equation implies that the level of the exchange rate can be mechanically split between expectations about the future path of short-term interest rate differentials and currency risk premia.[12] To the extent that the current and expected future path of short-term interest rate differentials quantitatively dominates currency risk premia, it follows that the exchange rate may react more strongly to news about the path of the short-term policy rate than to news about asset purchases that operate through the compression of term premia.
In line with the predictions of uncovered interest rate parity, model-based analysis indeed confirms that the euro-US dollar exchange rate is much more reactive to “rate expectations” policy shocks such as rate cuts than to “term premia” policy shocks, such as those due to the APP. Model-based results indicate that the bilateral euro-US dollar exchange rate on average reacts more than twice as strongly to a monetary policy shock affecting rate expectations compared to a policy shock of similar size to the term premium (Chart 4).[13] Similar results hold when using the effective exchange rate of the euro.[14]
Estimated effect on the EUR/USD exchange rate of a negative 10 basis point “rate expectations” vs. “term premium” monetary policy shock
It is plausible that the impact of rate cuts on the euro exchange rate has intensified over time, especially since the deposit facility rate moved into negative territory in June 2014. Re-estimations of the model I just described over one-year time intervals indicate that the euro exchange rate has become increasingly sensitive to rate expectation shocks (Chart 5).[15] After the introduction of the negative interest rate policy, the impact depreciation following a 10 basis point lowering of rate expectations has more than doubled compared with the rate cuts implemented in the aftermath of the global financial crisis. These findings are in line with a recent study that shows that the reaction of the exchange rate to monetary policy shocks becomes stronger when interest rates are lower (Ferrari et al. 2017).[16]
Time-varying effect on the EUR/USD exchange rate following a 10 basis point policy-induced decline in rate expectations
While the evidence presented suggests that, for a given shock size, rate cuts have a larger exchange-rate effect than changes in term premia, the sheer scale of the APP means that the sharp decline in term premia has been an important driver of the euro exchange rate.[17] In fact, according to the model, the cumulated negative impact of the term premium shock on the euro since mid-2014 is more than double the contribution of the rate expectation shock. This reflects the fact that term premia have declined much more than rate expectations since mid-2014.[18]
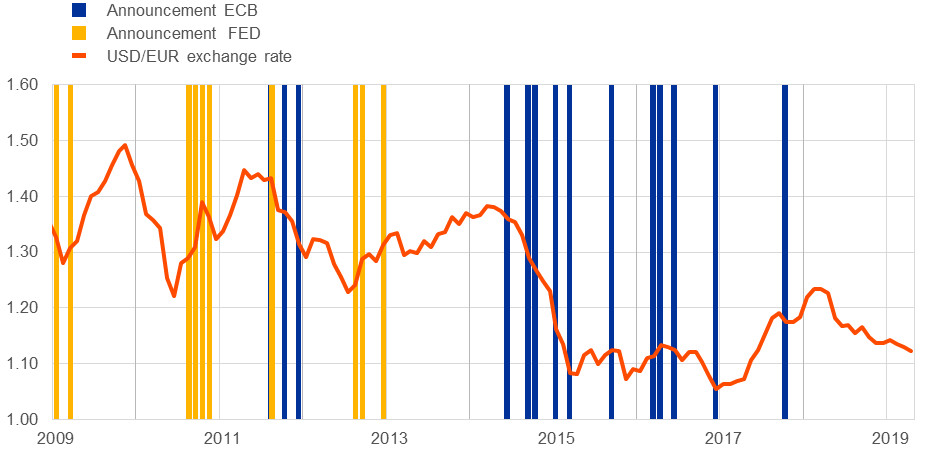
A role for term premia in influencing the euro exchange rate is in line with Dedola et al. (2019). These authors point to several transmission channels through which the APP has significantly affected the euro/US dollar exchange rate.[19] At a basic level, there has been a clear correlation between changes in the relative balance sheet sizes of the ECB and the Federal Reserve and in the euro/US dollar exchange rate (Chart 6). The authors use announcements of quantitative easing (QE) type measures to predict future changes in the relative sizes of central bank balance sheets. In turn, they estimate the effects of these exogenous balance sheet changes on exchange rates – and other relevant asset prices – over time.[20]
Relative balance sheet, the USD/EUR exchange-rate and QE announcements
The authors find that QE measures have had large and persistent effects on the euro exchange rate. Chart 7 (left side) shows the impulse response of the nominal US dollar-euro exchange rate to a relative QE shock that expands the ECB's balance sheet relative to that of the Federal Reserve by 1 percentage point over the following nine months using a sample of observations that starts during the global financial crisis in 2008. The euro immediately depreciates against the dollar, peaking at around 0.35 percent below baseline after nine months. The depreciation is quite persistent and statistically significant up to 18 months.
Impulse response to a relative ECB-Federal Reserve QE shock
Regarding the transmission channels, a QE shock that expands the ECB's balance sheet relative to that of the Federal Reserve works to a significant extent through the “signalling channel”. It persistently reduces the euro/dollar short-term money market rate differentials and shifts market expectations regarding the timing of a lift-off further into the future (Chart 7, right side). The largest contribution, stems from the effects of QE on residual risk premia in foreign exchange markets, as is shown in Chart 8 (see the red bars). The substantial role of risk premia echoes the evidence from classic studies that a large share of the variation in the dollar exchange rate is attributable to this residual risk premium component.[21] QE also exacerbates limits to arbitrage in foreign exchange markets, since it widens covered interest parity deviations reflected in the cross-currency basis, but not to an economically large extent.
Decomposition of exchange rate response to a relative ECB-Federal Reserve QE shock
The estimates of the effects of QE on the exchange rate remain fairly comparable with those of conventional monetary policy. A one percent increase in the ECB’s balance sheet relative to that of the Federal Reserve leads to an appreciation depreciation of the euro relative to the dollar in the order of 0.35 percent which is broadly comparable with the exchange rate effect of an unanticipated two basis point decline in one-year interest rates in the euro area relative to those in the United States.[22]
Implications of monetary policy for global liquidity conditions
This brings me to my next point as to whether our monetary policy actions have an impact on global liquidity. It is well established that US monetary policy is a key driver of the global financial cycle.[23]
At a qualitative level, there is similar evidence for the euro area: ECB monetary policy easing reverberates globally by spurring euro-denominated loans outside the euro area. For instance, Chart 9 shows that the growth of euro-denominated credit to borrowers outside the euro area has outpaced that of US-dollar-denominated credit to non-US borrowers in recent years. [24],[25]
Recent research by ECB staff suggests that our unconventional monetary policy measures, particularly the credit easing programmes, have played a role in supporting cross-border lending by euro area banks.[26] In response to the ECB’s accommodative monetary policy, euro area banks operating internationally have reallocated funds abroad within their respective banking organisations. In turn, the greater supply of euro-denominated funds outside the euro area has supported euro-denominated lending by banks outside the euro area.[27]
Currency composition of outstanding amounts of international loans in selected major currencies
Turning from bank financing to bond financing, the impact of the ECB’s non-standard measures on euro-denominated international bond issuance is limited, due to two offsetting effects.[28] On the one side, an accommodative unconventional monetary policy shock leads to a decline in euro area interest rates, which tends to stimulate international bond issuance in euro. On the other side, such a shock amplifies deviations from covered interest parity – the premium demanded by market participants for taking on a foreign currency exposure over and beyond interest rate differentials. This deviation – also known as the cross-currency swap basis – determines the euro’s attractiveness as an international funding currency for the synthetic issuance of US dollar bonds (in other words, issuing euro-denominated bonds and immediately swapping the euro proceeds on them for US dollars). A more negative basis increases the costs of synthetic US dollar funding through euro debt markets, which tends to discourage international bond issuance in euro. By and large, these two effects tend to offset each other, as suggested by the statistically insignificant response of international bond issuance in euro to a shock caused by the ECB’s accommodative asset purchases.
International financial flows and monetary policy
International portfolio flows
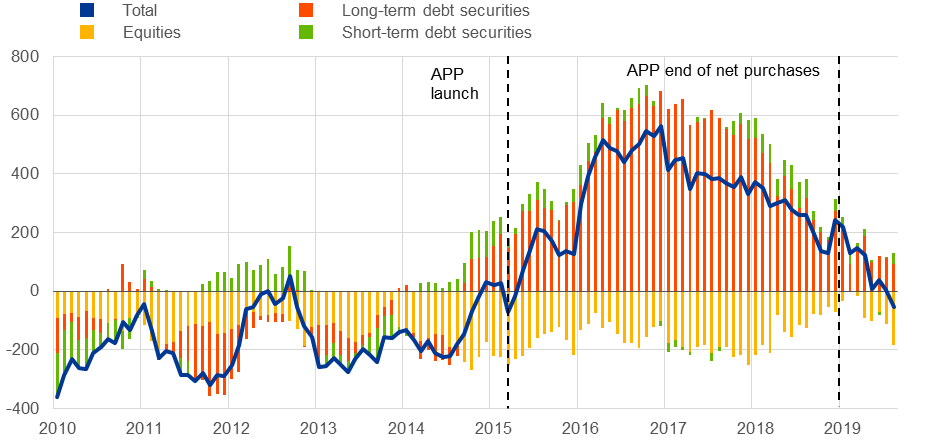
Let me now turn to the impact of our monetary policy on international financial flows. As documented in previous contributions by my colleague Benoit Coeuré, the APP’s introduction was followed by a striking swing from a sustained period of net portfolio flows into the euro area to sizeable net portfolio flows out of the euro area (Chart 10).[29] Net portfolio outflows reached their peak in 2016, when the monthly pace of APP purchases was at its fastest, and then gradually receded, broadly in tandem with the successive reductions in the pace of monthly purchases until it reached zero at the end of 2018. The substantial net outflows observed during the previous APP net purchase phase were almost entirely accounted for by portfolio flows into long-dated foreign securities, which outstripped by a wide margin the continued net inflows into euro area equities.[30] The ending of this phase of net purchases in December 2018 marks an important pivot in the data, with the convergence of net portfolio outflows to zero by the middle of 2019.
Breakdown of euro area net portfolio investment flows
(EUR billions; twelve-month moving sums)
Source: ECB.
Notes: A positive (negative) number indicates net outflows (inflows) from (into) the euro area. Equity includes investment fund shares. APP stands for asset purchase programme.
Latest observation: August 2019.
Euro area investors contributed sizeably to the net portfolio outflows by investing heavily in long-term foreign fixed income securities during the APP period (Chart 11). Euro area investors rebalanced their portfolios particularly towards sovereign bonds issued by other advanced economies, most notably US Treasuries, but also sovereign bonds of other jurisdictions such as the United Kingdom and Japan (Chart 12).[31] This type of investment strategy was notably carried out by euro area investment funds through which households channelled their rebalancing from domestic into overseas debt securities.[32] Since the end of net asset purchases at the end of December 2018, flows into non-euro area bonds have become mainly restricted to those issued in the United States, while flows into the United Kingdom, Japan and other jurisdictions have largely evaporated.
Euro area portfolio investment abroad
(EUR billions; twelve-month moving sums)
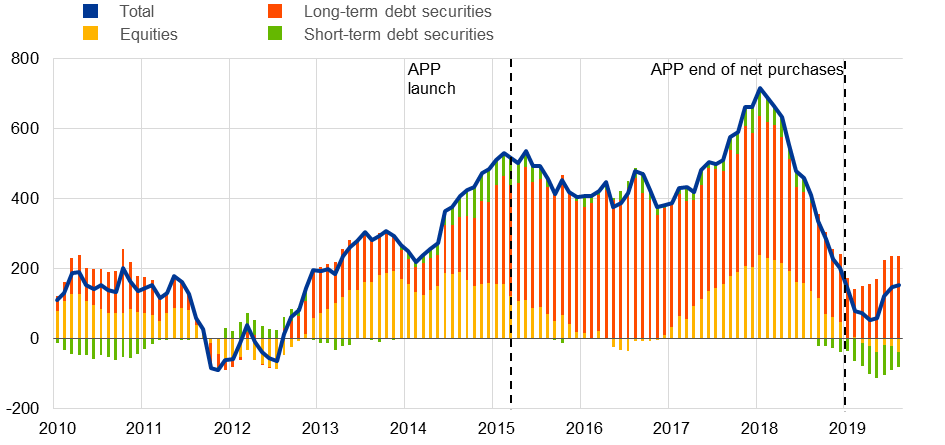
Source: ECB.
Notes: A positive (negative) number indicates net purchases (sales) of non-euro area securities by euro area investors. Equity includes investment fund shares. APP stands for asset purchase programme.
Latest observation: August 2019.
Geographical breakdown of euro area investors’ net purchases of non-euro area debt securities
(percentage of euro area GDP; four-quarter moving averages)
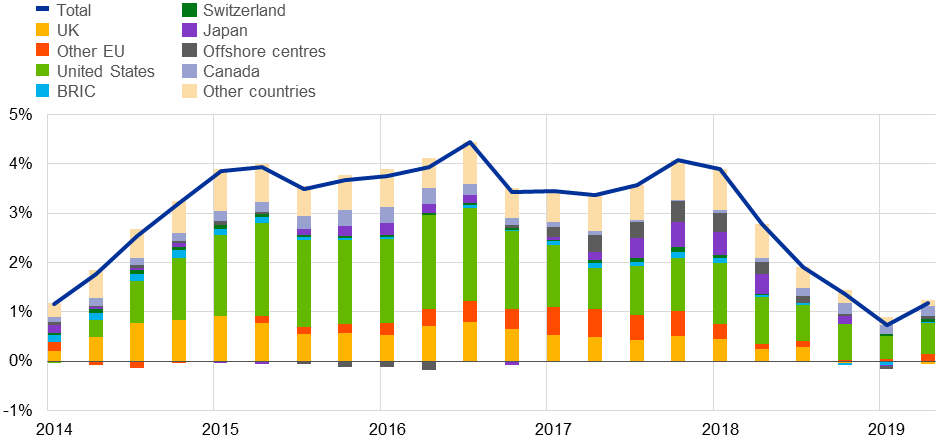
Sources: ECB and Eurostat.
Notes: A positive (negative) number indicates net purchases (sales) of foreign debt securities by euro area investors. “BRICs” comprises Brazil, Russia, India and China; “other EU” comprises EU Member States outside the euro area, excluding the United Kingdom.
Latest observation: Q2 2019.
Non-euro area investors have also been a driving force behind the overall net outflows in portfolio investment though net sales of euro area government debt securities (Chart 13). These net sales have been another key feature of euro area financial flows since the APP’s launch, mainly reflecting the important role of non-residents as counterparties to the Eurosystem in the APP’s implementation.[33] In contrast, 2019 has seen a different profile, with the end of net purchases under the APP correlated with the resumption of net buying of long-term debt securities by foreign investors.
Foreign portfolio investment in the euro area
(EUR billions; twelve-month moving sums)
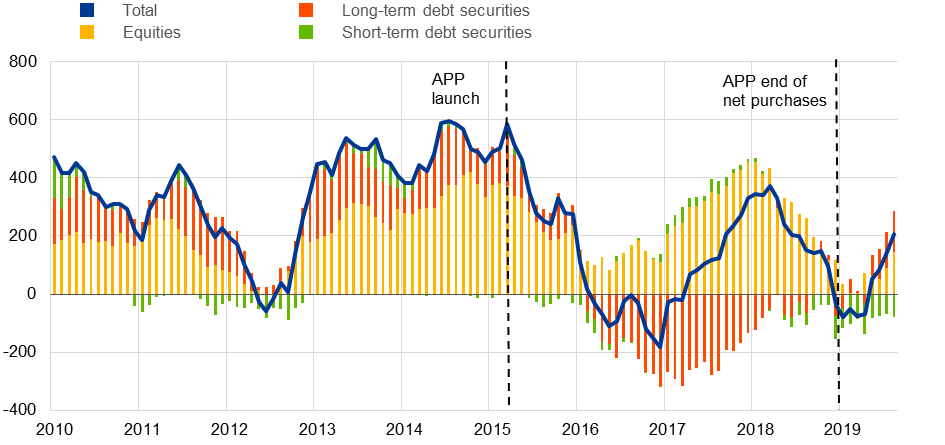
Source: ECB.
Notes: A positive (negative) number indicates net purchases (sales) of euro area securities by non-euro area investors. Equity includes investment fund shares. APP stands for asset purchase programme.
Latest observation: August 2019.
More generally, it is remarkable how closely cross-border portfolio flows have tracked the amount of bonds that were eligible for purchase under the public sector purchase programme (PSPP) but that were not absorbed by it (Chart 14). This suggests that the degree to which investors – both from the euro area and abroad – were rebalancing their portfolios from euro area to foreign sovereign paper was significantly driven by the availability of euro area bonds (net of the purchasing requirements of the Eurosystem under the APP).
Net portfolio investment in the euro area
(EUR billons; twelve-month flows)
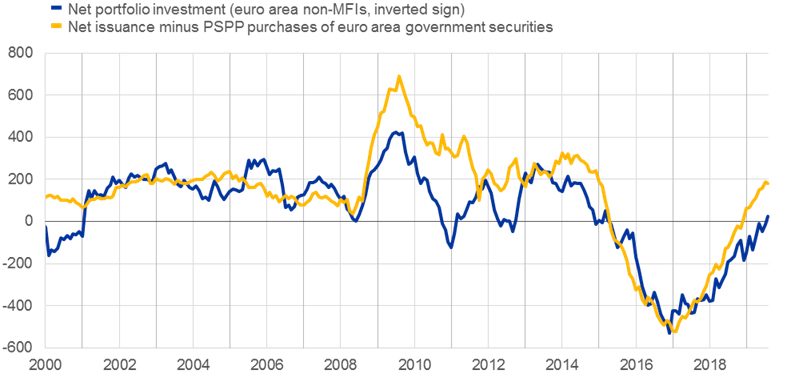
Source: ECB.
Notes: Assets (and therefore also net amounts) of portfolio investment are displayed with negative sign in order to match the related monetary flows. PSPP stands for public sector purchase programme.
Latest observation: August 2019.
Additional insight into the dynamics of international financial flows can be gained from viewing international portfolio flows through the lens of monetary arithmetic. Chart 15 shows how the APP became the dominant source of money creation in the euro area during the previous phase of net asset purchases. M3 growth had fallen close to zero by 2013 (as loan growth became negative in large parts of the euro area), but the APP injected fresh liquidity into the system, since the Eurosystem paid for the securities purchased under the programme by creating reserves and deposits. While, at that point, the swing towards net monetary outflows to the rest of the world (measured by the decline in the banking sector’s net external asset position) tempered the growth rate of broad money, these dynamics went into reverse when the exogenous impulse to money creation from APP net purchases began to fade. In particular, the increase in the net external asset position of the banking sector has supported domestic broad money growth in recent months.
The role of cross-border flows in monetary dynamics
Changes in the net external asset position of euro area MFIs reflects monetary exchanges with the rest of the world, the dynamics of which has been driven in recent years by the net portfolio outflows that I have described, as can be seen in the monetary presentation of the balance of payments. By construction, this perspective abstracts from the banking sector’s autonomous actions. Nonetheless, the net external asset position of the banking sector reflects their roles as intermediaries in cross-border payments and as issuers of the bank deposits that form the main instruments for international payments.[34],[35]
In this way, the monetary presentation of the balance of payments illustrates that external monetary inflows and outflows over the last decade have stemmed mainly from two types of cross-border activity: first, transactions of a financial origin (dominated by international portfolio flows) and, second, the proceeds from the significant current account surplus (Chart 16). In fact, this sizeable surplus represents a persistent source of monetary inflows that has tempered the impact of APP-induced portfolio outflows on euro area monetary dynamics.
The monetary presentation of the balance of payments
The role of global portfolio rebalancing frictions in DSGE models
Finally, a central question in assessing the impact of our asset purchase programmes is the mechanics of international portfolio adjustment. Let me look again at the effects of asset purchases in the presence of portfolio rebalancing frictions, based on simulations of two open-economy models.[36] In the dynamic stochastic general equilibrium (DSGE) models considered here, asset purchases in the domestic economy drive down yields of domestic long-term government bonds and incentivise portfolio rebalancing. In particular, the strength of the exchange rate effect in the models depends on portfolio rebalancing frictions that operate both through a credit channel (whereby banks sell bonds to the central bank and originate more/cheaper credit) as well as an exchange rate channel (whereby the rest of the world adjusts its portfolio position vis-à-vis the euro area, contributing to exchange rate depreciation).
The model simulations indicate that global portfolio rebalancing is an important channel through which an asset purchase programme stimulates the domestic economy and that its presence can influence the evolution of the trade balance. In particular, the impact of portfolio rebalancing on the exchange rate is quite powerful in reinforcing the strength of monetary policy stimulus imparted by asset purchases. This results in a larger impact on GDP (Chart 17) and a more positive response of the trade balance (Chart 18). Finally, according to the models, global portfolio rebalancing is more important for the transmission of an asset purchase programme than for the transmission of an interest rate shock. For example, results from the NAWM II show that the transmission of a domestic interest rate shock is largely invariant to global portfolio rebalancing frictions.
The effects of global portfolio rebalancing on GDP – evidence from DSGE models
The effects of global portfolio rebalancing on trade balance – evidence from DSGE models
Conclusions
In this speech I have focused on the international dimensions of the transmission of our monetary policy. Given the open nature of the euro area economy, cross-border channels are crucial in evaluating how our policy stance affects the euro area, while also influencing global economic and financial conditions.
One lesson from recent years is that since our various policy measures (the short-term policy rate; the asset purchase programme; our credit-easing measures) work through quite different cross-border channels, it is important to consider the specific design of our monetary policy packages when tracing out the international transmission of monetary policy. A second lesson is that the responses of exchange rates and international financial flows to monetary policy innovations have shifted over time, especially in the light of the differences between “traditional” macro-financial environments and the current environment in which short-term policy rates are either low or negative and central bank balance sheets have expanded so much. Accordingly, there is a rich and challenging research agenda in international monetary economics and I look forward to the advances that will be made by the researchers in the CEPR’s IMF programme.
- [1]I am grateful for the contribution of Ramon Adalid, Michele Ca’ Zorzi, Johannes Gräb, Jonas Jensen, Michael Kühl, Arnaud Mehl, Georg Müller, Arthur Saint-Guilhem, Martin Schmitz and Ine Van Robays in the preparation of this speech.
- [2]I wear two hats at this event - in addition to my role at the ECB, I am also a research fellow in this programme.
- [3]Although the global impact of ECB is not the main focus of today’s speech, the monetary expansion by a major central bank is typically simulative for the rest of the world.
- [4]Recent academic research has also explored the interconnections between international portfolio allocations and optimal monetary policy. It is beyond the scope of this speech to review this literature.
- [5]I previously studied the impact of monetary policy shocks on the current account in Lane, P. R. (2001), "Money Shocks and the Current Account," in G. Calvo, R. Dornbusch and M. Obstfeld (eds.) Money, Factor Mobility and Trade: Essays in Honor of Robert Mundell, MIT Press, pp. 385-411.
- [6]At least after some time in line with the standard J-curve effect which holds under the so-called Marshall–Lerner conditions (named after economists Alfred Marshall and Abba Lerner). If the domestic currency depreciates, imports become more expensive and exports cheaper due to changes in relative prices; the depreciation will lead to an improvement in the trade balance if the absolute sum of the long-term export and import demand elasticities is greater than unity.
- [7]On the role of invoicing currency patterns see also Lane, P. R. ”Globalisation and monetary policy”, speech at UCLA, 30 September 2019, and Boz, E., Gopinath, G., Casas, C., Diez, F., Gourinchas, P.-O. and Plagborg-Moller, M. (2019), “Dominant Currency Paradigm”, American Economic Review, forthcoming. For example, a tightening in US monetary policy that is followed by a multilateral appreciation of the US dollar elicits a much stronger slowdown in global trade under dominant currency pricing (DCP) than under producer currency pricing (PCP). The reason is that a larger share of global trade prices is sticky in US dollars under DCP, even if the related trade does not involve the United States. As a result, a larger share of global imports becomes more expensive in local currency terms in response to the appreciation of the US dollar, which elicits expenditure switching from imports to domestically produced goods.
- [8]See Auer, S. (2019), “Monetary policy shocks and foreign investment income: Evidence from a large Bayesian VAR”, Journal of International Money and Finance, Elsevier, vol. 93(C), pp. 142-166.
- [9]See Ca’ Zorzi, M., Dedola, L., Georgiadis, G., Jarociński, M., Stracca, L. and Strasser, G., “Monetary policy and its transmission in a globalised world”, ECB Discussion Paper, forthcoming.
- [10]Curcuru, S., Kamin, S., Li, C., Rodriguez, M. (2018), “International Spillovers of Monetary Policy: Conventional Policy vs. Quantitative Easing ” find that quantitative easing policies do not exert greater international spillovers than monetary policy.
- [11]The relation between international flows and the exchange rate is explored in the speech by Benoit Cœuré “Monetary policy, exchange rates and capital flows”, 3 November 2017.
- [12]Among others, this is recalled in Engel and West (2005, 2010).
- [13]One mechanism behind this could be that the exchange rate is determined more by market participants active at the short end of the yield curve, such as traders involved in carry trade strategies, than by market participants active at the long end of the yield curve, such as global bond asset managers.
- [14]When replacing the bilateral euro-US dollar exchange rate with the nominal effective exchange rate of the euro, a 10 basis point decline in the rate expectations and term premium policy shock depreciate the euro effective exchange rate by about 1% and 0.3%, respectively, on average over the sample.
- [15]The exchange rate sensitivity to policy-induced shocks to the term premium seems to have been much more stable over time according to this model.
- [16]See Ferrari, M., Kearns, J. and Schrimpf, A. (2017), “Monetary policy’s rising FX impact in the era of ultra-low rates”, BIS Working Paper, No 626.
- [17]The yield impact of the APP is estimated in Eser, F., Lemke, W., Nyholm, K., Radde, S. and Vladu, A.L. (2019), “Tracing the impact of the ECB’s asset purchase programme on the yield curve”, Working Paper Series, No 2293, ECB.
- [18]Based on the Joslin, Singleton and Zhu (2011) yield curve decomposition of the ten-year OIS, the estimated rate expectations component decreased by around 30 basis points since early May 2014 compared with a decline of around 100 basis points in the term premium. This might also reflect that term premia have been positively correlated with currency risk premia over this period.
- [19]See Dedola, L., Georgiadis, G., Gräb, J. and Mehl, A. (2018), “Does a big bazooka matter? Central bank balance-sheet policies and exchange rates”, Working Paper Series, No 2197, ECB.
- [20]Various empirical studies have tried to identify the effects of quantitative easing (QE) on the exchange rate, typically by means of event studies that consider a narrow time window around QE announcements. This provides evidence on the impact effects of QE announcements. However, this is less useful for shedding light on the persistence of the effects and the transmission channels of QE beyond the very short term. For surveys of the literature, see Bhattarai, S. and Neely, C. (2016), “A Survey of the Empirical Literature on U.S. Unconventional Monetary Policy”, Working Paper Series, No 2016-21, Federal Reserve Bank of St. Louis; Borio, C. and Zabai, A. (2016), “Unconventional Monetary Policies: A Re-appraisal”, BIS Working Papers, No 570.
- [21]See Engel, C. and West, K. (2010), “Global Interest Rates, Currency Returns, and the Real Value of the Dollar,” American Economic Review 100, pp. 562-567 and C. Engel (2016), “Exchange Rates, Interest Rates, and the Risk Premium”, American Economic Review 106, pp. 436-474.
- [22]See Ca’Zorzi et al., op. cit.
- [23]See Rey, H., “Dilemma, not trilemma: the global cycle and monetary policy independence”, Proceedings – Economic Policy Symposium – Jackson Hole, Federal Reserve Bank of Kansas City, 2013, pp. 1‑2.
- [24]International loans are defined as loans by banks outside the currency area to borrowers outside the currency area. International loans in euro correspond to all euro-denominated loans by banks outside the euro area to borrowers outside the euro area.
- [25]See also the statistical release of BIS global liquidity indicators at end-June 2019, available at: https://www.bis.org/statistics/gli1910.pdf.
- [26]See Gräb, J. and Żochowski, D. (2017), “The international bank lending channel of unconventional monetary policy”, ECB Working Paper, No 2109.
- [27]See Cetorelli, N. and Goldberg, L. (2012), “Banking Globalization and Monetary Transmission”, Journal of Finance, Vol. 67(5), pp. 1811‑1843. As global banks respond to domestic monetary shocks by managing liquidity globally through an internal reallocation of funds between headquarters and foreign branches or subsidiaries, their foreign lending is more affected by domestic shocks.
- [28]See “The international role of the euro”, ECB (2017).
- [29]See Cœuré, B. (2017), “The international dimension of the ECB’s asset purchase programme”, speech at the Foreign Exchange Contact Group meeting, 11 July; Cœuré, B. (2018), “The persistence and signalling power of central bank asset purchase programmes”, speech at the 2018 US Monetary Policy Forum, New York City, 23 February 2018; Cœuré, B. (2018), “The international dimension of the ECB’s asset purchase programme: an update”, speech at a conference on “Exiting Unconventional Monetary Policies”, organised by the Euro 50 Group, the CF40 forum and CIGI, Paris, 26 October 2018.
- [30]Standard finance theory would predict that investors choose an equity portfolio that is diversified across the world if capital is fully mobile across borders. While the liberalisation of capital accounts, electronic trading and lower transactions have spurred cross-border asset trade (Lane and Milesi-Ferreti (2003), nonetheless home bias continues to be prevalent, see i.a. Poterba and French (1991) and Coeurdacier and Rey (2003).
- [31]See Bergant, K., Fidora, M. and Schmitz, M., “International capital flows at the security level – evidence from the ECB’s asset purchase programme”, ECMI Working Papers, No 7, Centre for European Policy Studies, 2018.
- [32]See Bergant, K., Fidora, M. and Schmitz, M., op. cit.
- [33]See the box entitled “Which sectors sold the government securities purchased by the Eurosystem?”, Economic Bulletin, Issue 4, ECB, 2017.
- [34]For more details see Picón Aguilar, C., Oliveira Soares, R., Adalid, R. (forthcoming), “Revisiting the monetary presentation of the euro area balance of payments”, Occasional Paper, ECB.
- [35]To give a stylised example, when a euro area household buys a US Treasury bond from a foreign investor, the household must send payment to the seller. This implies a reduction in household deposits and – in the simplest case – an increase in foreign deposits. This immediately creates a change in the net position of the domestic banking sector vis-à-vis the rest of the world. While banks can intermediate the cross-border payments of their clients in alternative and more complex ways, the outcome will nevertheless always be the same: cross-border transactions involving non-banking sectors or instruments issued by these sector imply changes in the net external position of the banking sector.
- [36]This exercise employs two open-economy DSGE models: first, the ECB’s New Area-Wide Model (NAWM II, see Coenen et al., 2018)), which models the euro area as a small-open economy linked to the global economy through trade in goods and cross-border financial investment. The second DSGE model features four euro area country blocks and a rest-of-the-world block. The model considers granular banking, sovereign and financial frictions, and cross-country heterogeneity (DJP, see Darracq Pariès et al. 2019).
Den Europæiske Centralbank
Generaldirektoratet Kommunikation
- Sonnemannstrasse 20
- 60314 Frankfurt am Main, Tyskland
- +49 69 1344 7455
- media@ecb.europa.eu
Eftertryk tilladt med kildeangivelse.
Pressekontakt

